
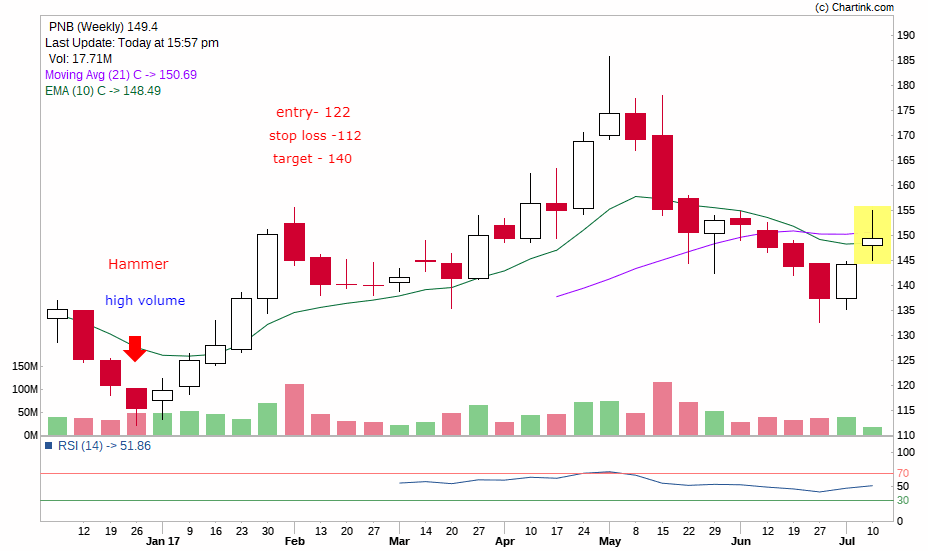
On 26th January 2017 a Hammer was spotted at the bottom of a downward trend, indicating a reversal in trend. The volume was significantly high. The next candle showed a bullish candle. That target was achieved on 30th January 2017.
feel free to call us +919500077790 info@eqsis.com
On 26th January 2017 a Hammer was spotted at the bottom of a downward trend, indicating a reversal in trend. The volume was significantly high. The next candle showed a bullish candle. That target was achieved on 30th January 2017.
| M | T | W | T | F | S | S |
|---|---|---|---|---|---|---|
| 1 | 2 | 3 | 4 | 5 | 6 | 7 |
| 8 | 9 | 10 | 11 | 12 | 13 | 14 |
| 15 | 16 | 17 | 18 | 19 | 20 | 21 |
| 22 | 23 | 24 | 25 | 26 | 27 | 28 |
| 29 | 30 | |||||
 Bearish-GAP-SHORT-BICON-25-10-2019 October 25, 2019
 FEDERAL BANK – BEARISH ENGULFING October 17, 2019
 Cummins India – Bearish Engulfing – 24Sep19 September 25, 2019
 Day29-Tata Motors DVR – Bearish Piercing – 12Sep19 September 12, 2019
 Day27-Bearish-Engulfing pattern-Tech Mahindtra-09Sep19 September 10, 2019
Stock Trading is business, the success depends not just on capital or subscribing advisory services or participating workshops. The factors such as your awareness level about business, Efforts and your contributions, Smartness, Knowledge in analysis and trading instrument, availability of infrastructure and emotional control determine your success.
EQSIS, A Stock Market Research Firm
Knowledge is Power. Here you may start from basics, get support while practicing and evolve as active analyst, later you can become a pro


Hammer should appear below the previous candle. The Hammer body should be tiny and place on top of the candle. The lower tail should be lengthy..
Hammer should appear below the previous candle. The Hammer body should be as small as . The lower tail should be lengthy n upper tail should be as small as..