
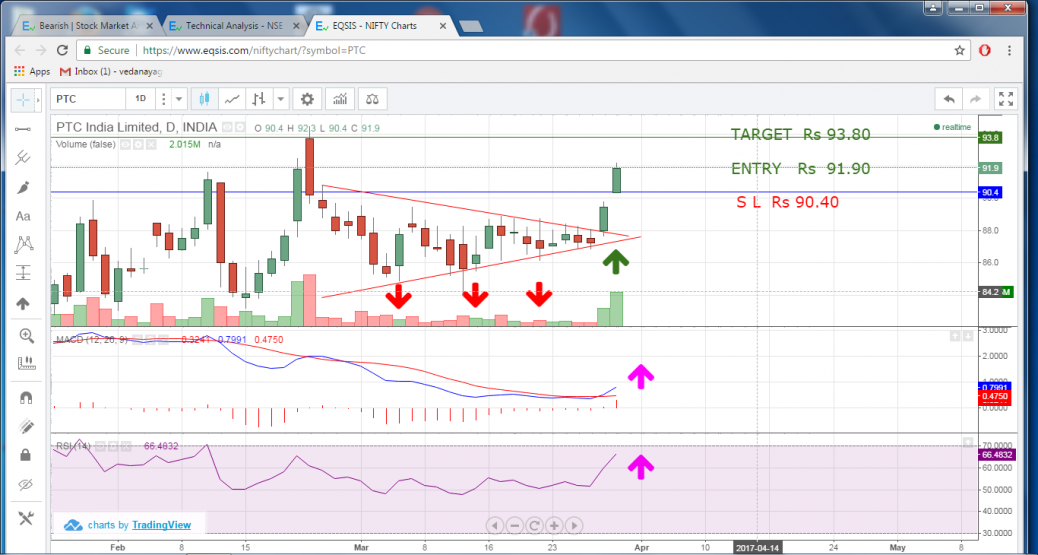
PTC breaks yesterday the sym triangle with adequate vol and today bulls confirmed with break up with more volume. The probable uptrend is also justified by two indicators and OI 82.25% AND Del vol 43.65%
feel free to call us +919500077790 info@eqsis.com
PTC breaks yesterday the sym triangle with adequate vol and today bulls confirmed with break up with more volume. The probable uptrend is also justified by two indicators and OI 82.25% AND Del vol 43.65%
| M | T | W | T | F | S | S |
|---|---|---|---|---|---|---|
| 1 | 2 | 3 | 4 | 5 | 6 | 7 |
| 8 | 9 | 10 | 11 | 12 | 13 | 14 |
| 15 | 16 | 17 | 18 | 19 | 20 | 21 |
| 22 | 23 | 24 | 25 | 26 | 27 | 28 |
| 29 | 30 | |||||
 Bearish-GAP-SHORT-BICON-25-10-2019 October 25, 2019
 FEDERAL BANK – BEARISH ENGULFING October 17, 2019
 Cummins India – Bearish Engulfing – 24Sep19 September 25, 2019
 Day29-Tata Motors DVR – Bearish Piercing – 12Sep19 September 12, 2019
 Day27-Bearish-Engulfing pattern-Tech Mahindtra-09Sep19 September 10, 2019
Stock Trading is business, the success depends not just on capital or subscribing advisory services or participating workshops. The factors such as your awareness level about business, Efforts and your contributions, Smartness, Knowledge in analysis and trading instrument, availability of infrastructure and emotional control determine your success.
EQSIS, A Stock Market Research Firm
Knowledge is Power. Here you may start from basics, get support while practicing and evolve as active analyst, later you can become a pro


Good Spot, But the stoploss can be placed below the Triangle swing, not below the today low.
@eqsis Dear sir
If the stop loss is placed in a macroscopic way the trade plan will not be viable since the target cannot be placed above the immediate RESISTANCE . Even now RETURN is slightly more than the RISK
Additional observations to that ……@ 94 it is facing a resistance (Double top) . If it crosses that ,it ma move up to 104.
Dear sir
Further up trend after the resistance (93.90) can be taken in to account after seeing the. the candle and volume of the break out.Bull trend can be the result of DOUBLE BOTTOM while the scrip is in DOWN TREND.Now the existing trend is already UP. and hence double bottom we cannot taken in to account. However thank you for viewing the chart and sharing the views
The long trade most probably may not work out since bulls are not appears strong enough.(9.25 A.M)
@veda417 @kkarthikeyan1974
Here the stock rallied and faced resistance at the expected levels, interestingly now it is sketching the flag pattern (rectangle shape), hence any breakout from current levels can also be utilize for long positions.
Good work and thanks for the healthy conversation.
Thanks for update ….
Also if it breaks above 94 or 95 range next resistance is at 102 range ….
DEAR Mr Murugan
Thanks for the followup and this scrip is in our watch list