
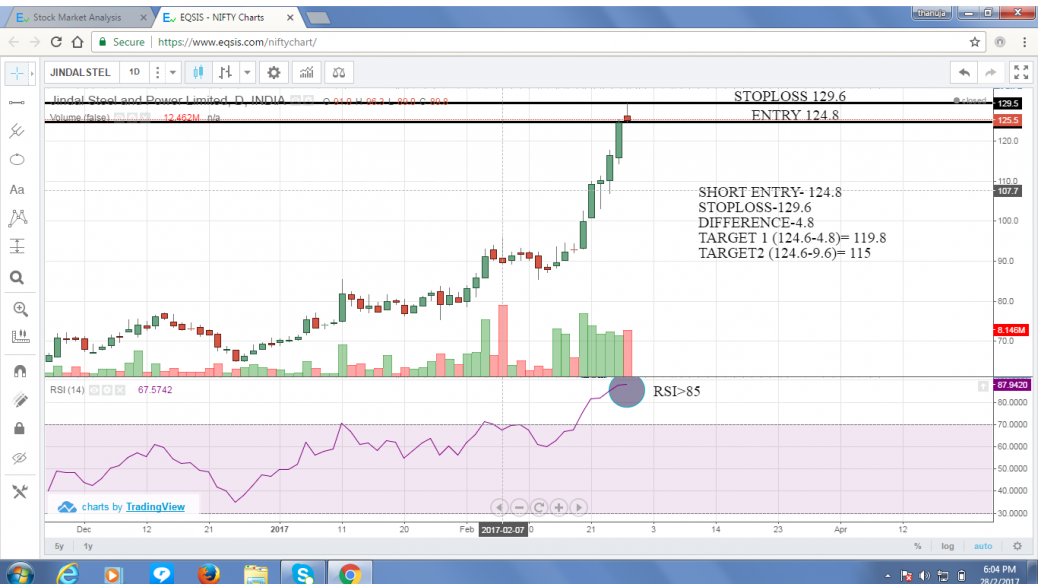
After a long rally today it has formed hanging man also RSI>85 which indicates stock is likely overbought and hanging man indicates bearish trend reversal so we should create short at hanging day low and stoploss is high on the hanging day where as here the target is likely even two times of the risk taken


This is inverted hammer. Hanging man looks long leg appears below with candle stick.
It is important to note that the Inverted pattern is a warning of potential price change, not a signal, in and of itself, to buy.
@eqsis Kindly review my response.
RSI 85 indicates strong momentum, it may indicate overbought scenario only if it falls below 70 mark… Meanwhile the Bearish candlestick pattern indicates short term weakness…
@eqsis : yes sir, i agree that fundamentally the stock is strong also here today hanging man and volume is huge also that indicates temporary weekness.
@Tamil Selvam J: Are you sure that it is not a hanging man? because i just started one month ago i remember it as hanging man.
i agree with tamilselvam, but i thought this as hanging man (Actually its is called as shooting star). However the implication is bearish.
If the upper tail is big, then it indicates the strong selling pressure.
@eqsis: thankyou sir for clearing my doubt
This stock headed lower levels, Currently RSI hovers below 70 levels