- A simple moving average (SMA) calculates the average of a selected range of prices, usually closing prices, by the number of periods in that range.
- A simple moving average is a technical indicator that can aid in determining if an asset price will continue or if it will reverse a bull or bear trend.
- A simple moving average can be enhanced as an exponential moving average (EMA) that is more heavily weighted on recent price action.
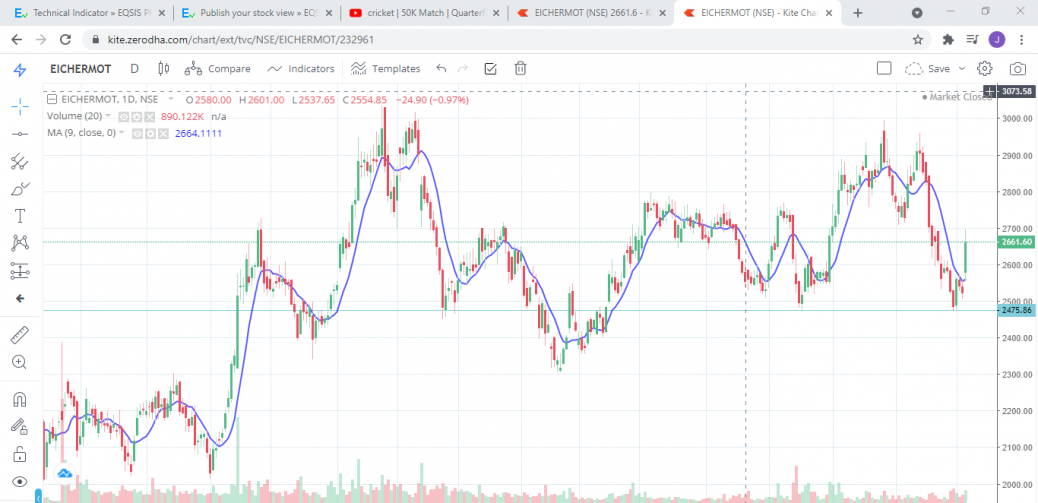
- ON EICHER MOTOR chart sma indicates bullish reversal momentum
- my trading plan is
- buy above 2662
- S.L: 2555
- TARGET :2770
simple moving average(9) indicates bullish momentum on EICHER MOTORS
feel free to call us +919500077790 info@eqsis.com
Stock Analysis
M | T | W | T | F | S | S |
---|---|---|---|---|---|---|
1 | 2 | 3 | 4 | 5 | 6 | 7 |
8 | 9 | 10 | 11 | 12 | 13 | 14 |
15 | 16 | 17 | 18 | 19 | 20 | 21 |
22 | 23 | 24 | 25 | 26 | 27 | 28 |
29 | 30 |
Bullish View
Bearish View
- Bearish-GAP-SHORT-BICON-25-10-2019 October 25, 2019
- FEDERAL BANK – BEARISH ENGULFING October 17, 2019
- Cummins India – Bearish Engulfing – 24Sep19 September 25, 2019
- Day29-Tata Motors DVR – Bearish Piercing – 12Sep19 September 12, 2019
- Day27-Bearish-Engulfing pattern-Tech Mahindtra-09Sep19 September 10, 2019
How this forum help stock traders?
Stock Trading is business, the success depends not just on capital or subscribing advisory services or participating workshops. The factors such as your awareness level about business, Efforts and your contributions, Smartness, Knowledge in analysis and trading instrument, availability of infrastructure and emotional control determine your success.
Hi,
Click the below link for more details about the moving average.
https://www.youtube.com/watch?v=CIMjXcBiZrA