
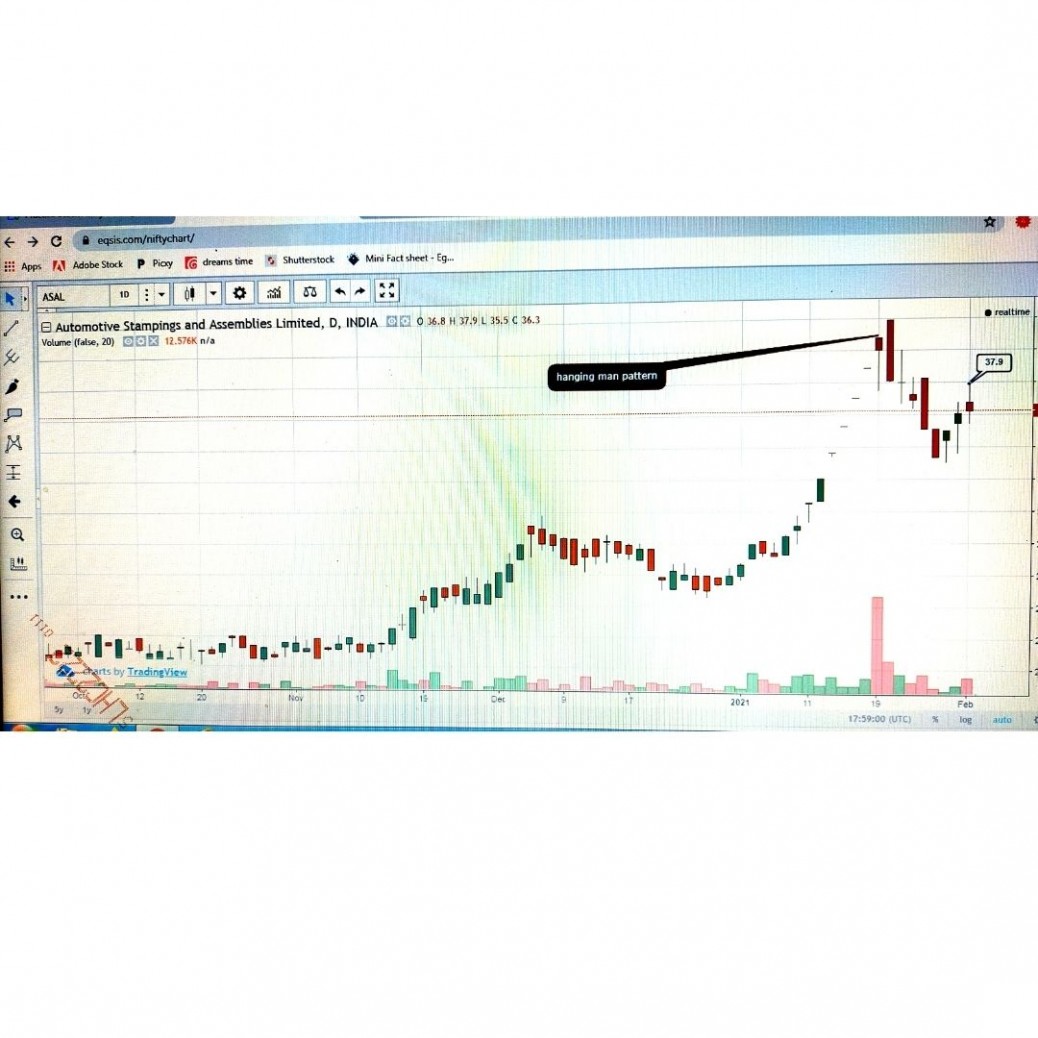
The chart shows the hanging man pattern appearing indicates the end of its bullish movement
now we can go short if it move below previous two days low we can consider a short
feel free to call us +919500077790 info@eqsis.com
The chart shows the hanging man pattern appearing indicates the end of its bullish movement
now we can go short if it move below previous two days low we can consider a short
| M | T | W | T | F | S | S |
|---|---|---|---|---|---|---|
| 1 | 2 | 3 | 4 | 5 | 6 | 7 |
| 8 | 9 | 10 | 11 | 12 | 13 | 14 |
| 15 | 16 | 17 | 18 | 19 | 20 | 21 |
| 22 | 23 | 24 | 25 | 26 | 27 | 28 |
| 29 | 30 | |||||
 Bearish-GAP-SHORT-BICON-25-10-2019 October 25, 2019
 FEDERAL BANK – BEARISH ENGULFING October 17, 2019
 Cummins India – Bearish Engulfing – 24Sep19 September 25, 2019
 Day29-Tata Motors DVR – Bearish Piercing – 12Sep19 September 12, 2019
 Day27-Bearish-Engulfing pattern-Tech Mahindtra-09Sep19 September 10, 2019
Stock Trading is business, the success depends not just on capital or subscribing advisory services or participating workshops. The factors such as your awareness level about business, Efforts and your contributions, Smartness, Knowledge in analysis and trading instrument, availability of infrastructure and emotional control determine your success.
EQSIS, A Stock Market Research Firm
Knowledge is Power. Here you may start from basics, get support while practicing and evolve as active analyst, later you can become a pro


Hi,
Hanging man have a small body with a long upper tail pattern. Hanging man is a bearish reversal pattern, as the buyers were initially in charge but yet the sellers were capable to reverse that control and drive prices back up to close near the low for the day.
Conditions
Hanging man have a small body with a long upper tail.
The lower tail should be invisible or very small in size.
Volume should be high during hanging man day.
Hanging man should be red in color.
Hanging man occur after a price incline