
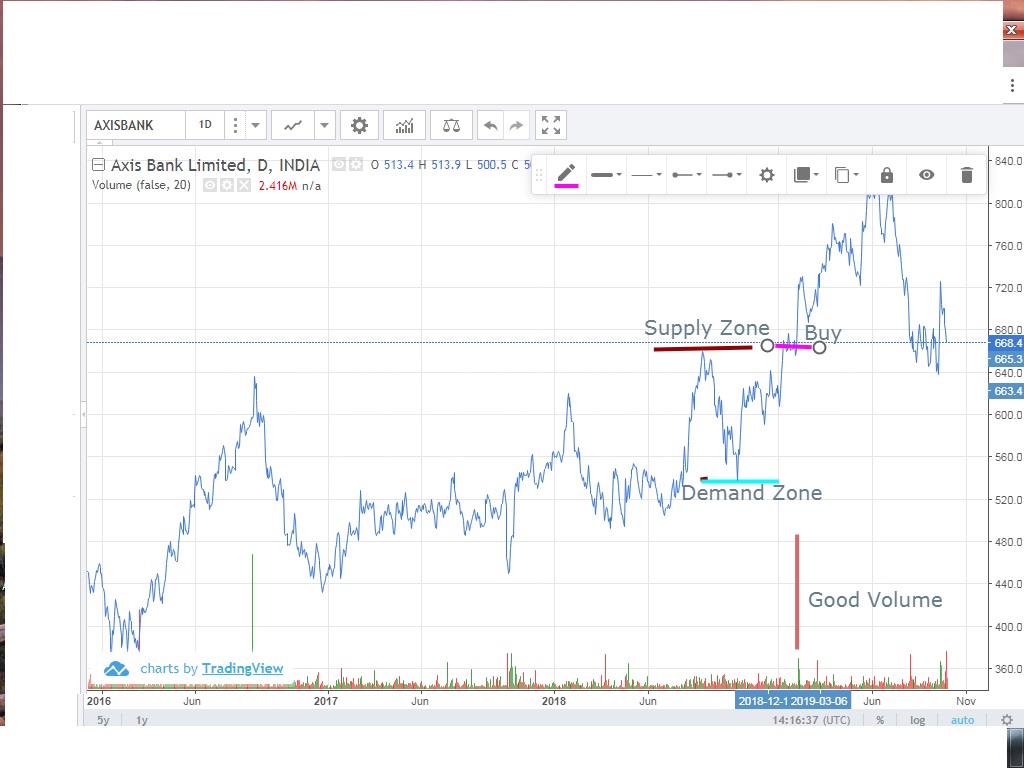
Huge Supply seen at 657.7 and Demand at 534.9, from there demand vs greater supply and positive to buy at 659 with stop loss of 607 and target at 711
feel free to call us +919500077790 info@eqsis.com
Huge Supply seen at 657.7 and Demand at 534.9, from there demand vs greater supply and positive to buy at 659 with stop loss of 607 and target at 711
| M | T | W | T | F | S | S |
|---|---|---|---|---|---|---|
| 1 | 2 | 3 | 4 | 5 | ||
| 6 | 7 | 8 | 9 | 10 | 11 | 12 |
| 13 | 14 | 15 | 16 | 17 | 18 | 19 |
| 20 | 21 | 22 | 23 | 24 | 25 | 26 |
| 27 | 28 | 29 | 30 | 31 | ||
 Bearish-GAP-SHORT-BICON-25-10-2019 October 25, 2019
 FEDERAL BANK – BEARISH ENGULFING October 17, 2019
 Cummins India – Bearish Engulfing – 24Sep19 September 25, 2019
 Day29-Tata Motors DVR – Bearish Piercing – 12Sep19 September 12, 2019
 Day27-Bearish-Engulfing pattern-Tech Mahindtra-09Sep19 September 10, 2019
Stock Trading is business, the success depends not just on capital or subscribing advisory services or participating workshops. The factors such as your awareness level about business, Efforts and your contributions, Smartness, Knowledge in analysis and trading instrument, availability of infrastructure and emotional control determine your success.
EQSIS, A Stock Market Research Firm
Knowledge is Power. Here you may start from basics, get support while practicing and evolve as active analyst, later you can become a pro


Hello Suresh,
For analysis using DOW theory, its good to mark major Tops & Bottoms and qualify them with HT, HB, LT & LB.
Although it is right, its good that we go by marking all the major tops and bottoms. Follow the below steps for dow theory.
Step 1: Mark Major Tops and Bottoms
Step 2: Qualify them as Higher or Lower
Step 3: Stop the matching sequence for bullish and bearish
Step 4: Indicate the high volume
Step 5: Place the stoploss and possible targets.
You can give an another attempt