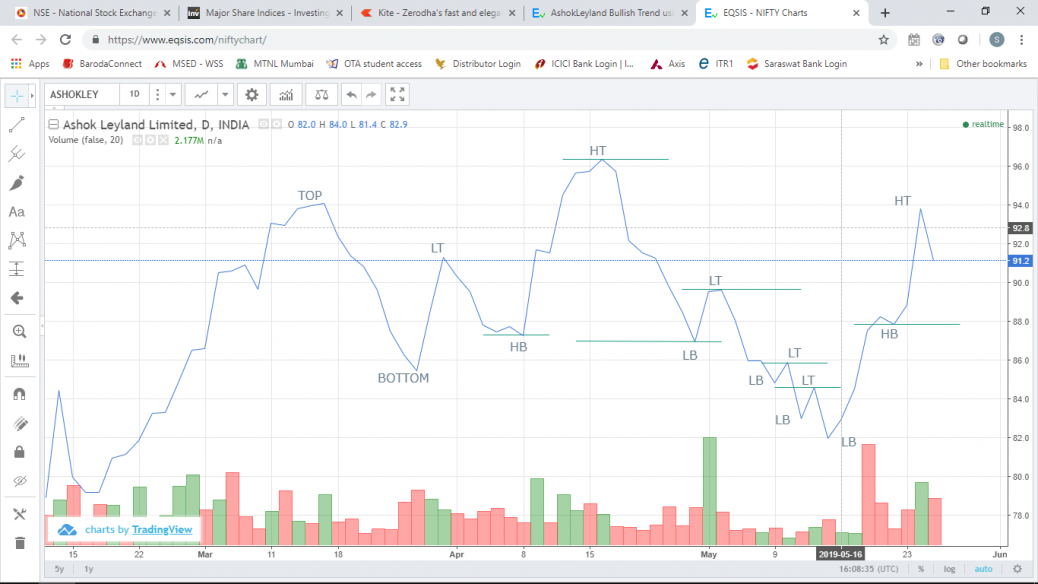
According to Dow Theory, for an Uptrend a sequence of HB-HT is required. After a decline from 16/Apr to 15/May, price created a Higher Bottom (HB) on 22/May. On 24/May, the required Higher top (HT) was created by price – as soon as it crossed above 91.8 with Volume above average.
AshokLeyland Bullish Trend using Dow Theory
feel free to call us +919500077790 info@eqsis.com
Stock Analysis
M | T | W | T | F | S | S |
---|---|---|---|---|---|---|
1 | 2 | 3 | 4 | 5 | ||
6 | 7 | 8 | 9 | 10 | 11 | 12 |
13 | 14 | 15 | 16 | 17 | 18 | 19 |
20 | 21 | 22 | 23 | 24 | 25 | 26 |
27 | 28 | 29 | 30 | 31 |
Bullish View
Bearish View
- Bearish-GAP-SHORT-BICON-25-10-2019 October 25, 2019
- FEDERAL BANK – BEARISH ENGULFING October 17, 2019
- Cummins India – Bearish Engulfing – 24Sep19 September 25, 2019
- Day29-Tata Motors DVR – Bearish Piercing – 12Sep19 September 12, 2019
- Day27-Bearish-Engulfing pattern-Tech Mahindtra-09Sep19 September 10, 2019
How this forum help stock traders?
Stock Trading is business, the success depends not just on capital or subscribing advisory services or participating workshops. The factors such as your awareness level about business, Efforts and your contributions, Smartness, Knowledge in analysis and trading instrument, availability of infrastructure and emotional control determine your success.
Hi SP sir, For doing Dow analysis we have to use line chart with a minimum period of 2 years. If we use candle sticks with shorter periods it may be illusory. I also did the same kind of mistakes in the beginning. 🙂
attached line chart
Thank you for your comment, will help for sure.