
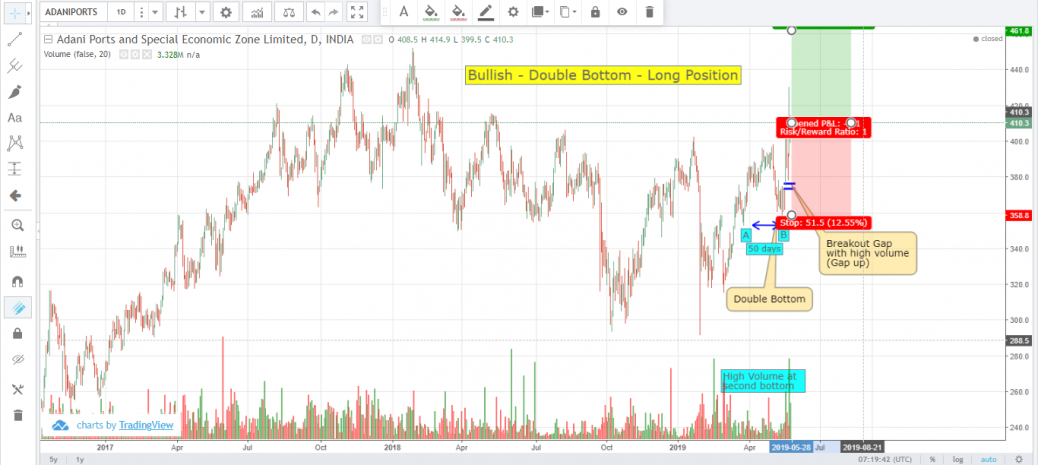
Adaniports stock shows Double bottom with 50 days duration and High volume. Also breakup gap noticed with high volume and it is not yet filled. Crossed the top hence long position need to be taken @ Current market price Rs. 410.3 with stop loss of Rs.358.8. Target – 1 month.


Hi Prakash, In case of double bottom the trend before the formation of bottoms must be negative for a longer duration, when compared to the bottom formation. It will be easier to identify the same using line charts. I too did the same mistake of using candle stick charts in the beginning but of late only got it corrected.
Thanks Mohan. Point noted.
In case of double bottom. Then trend will be such that prices will mostly fall again. But you are asking us the long postion. Is it because there is a break out gap after the double bottom?
Hi Meenu Ayyappan, In case of double bottom after crossing the neck crossing line with high volume, the price will tend to rise. So we have to take long position. In case of double top the vice versa.