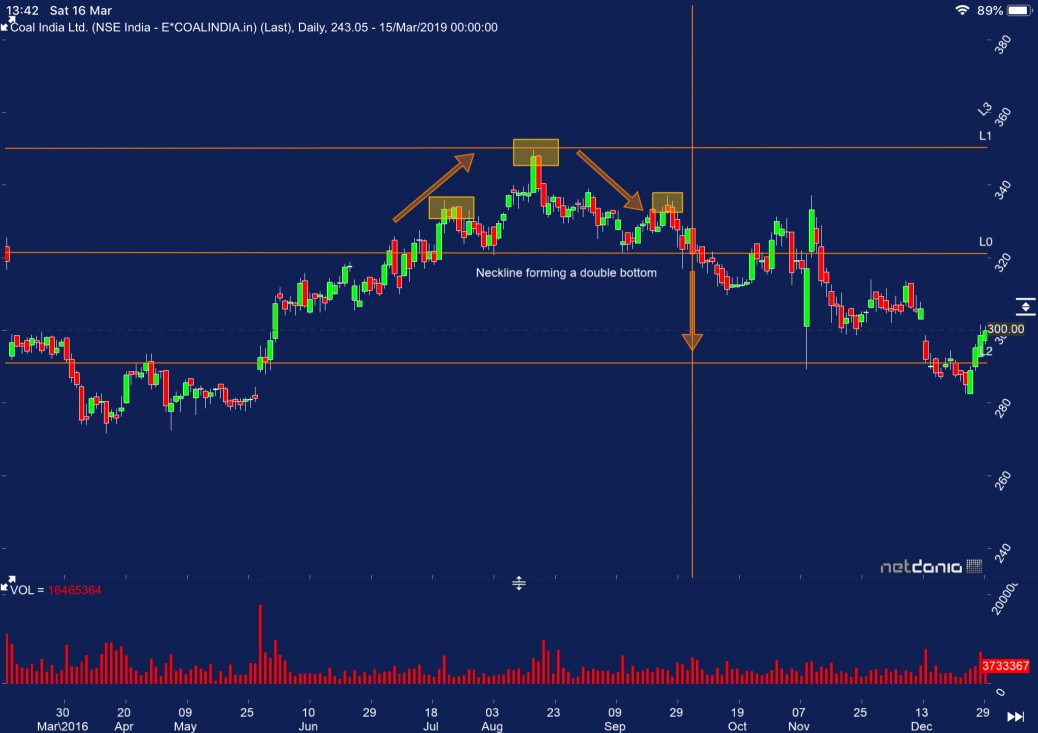
Strong rally seen between may till august 2016 making higher highs and higher low with minor corrections in between. From mid august till last week of September a downward rally is evident. Lower highs and lower low is seen between this period. A minor upward rally is seen from 321 levels suggesting a double bottom. A neckline is marked joining the bottoms formed on 4th august and 15th September. The neckline is broken on 7th October giving a good indication of head and shoulder pattern. Volume confirmation is also seen.
Coal India – H&S pattern
feel free to call us +919500077790 info@eqsis.com
Stock Analysis
M | T | W | T | F | S | S |
---|---|---|---|---|---|---|
1 | 2 | 3 | 4 | 5 | ||
6 | 7 | 8 | 9 | 10 | 11 | 12 |
13 | 14 | 15 | 16 | 17 | 18 | 19 |
20 | 21 | 22 | 23 | 24 | 25 | 26 |
27 | 28 | 29 | 30 | 31 |
Bullish View
Bearish View
- Bearish-GAP-SHORT-BICON-25-10-2019 October 25, 2019
- FEDERAL BANK – BEARISH ENGULFING October 17, 2019
- Cummins India – Bearish Engulfing – 24Sep19 September 25, 2019
- Day29-Tata Motors DVR – Bearish Piercing – 12Sep19 September 12, 2019
- Day27-Bearish-Engulfing pattern-Tech Mahindtra-09Sep19 September 10, 2019
How this forum help stock traders?
Stock Trading is business, the success depends not just on capital or subscribing advisory services or participating workshops. The factors such as your awareness level about business, Efforts and your contributions, Smartness, Knowledge in analysis and trading instrument, availability of infrastructure and emotional control determine your success.
Hi,
The formation of Head and Shoulder has been a continuous decrease in the volume. That means volume will be higher in the left shoulder and eventually it decreases with the formation of head and right shoulder. The main process of the head and shoulder pattern is accumulation and distribution