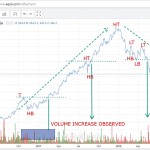
In the last two year chart of TVS Motors, both bullish and bearish conditions basing on Dow theory is observed.
Between Eeb 2017 and Dec 2017, a bull run was observed. From Late Dec 2017 and Oct 2018, a bearish run is observed.
No divergence is observed between the auto sector and TVS motors.
Bullish conditions like HB-HT and high volume are satisfied. Similarly, LT-LB with high volume is observed in bearish trend.


Hi,
Your point of view is right