
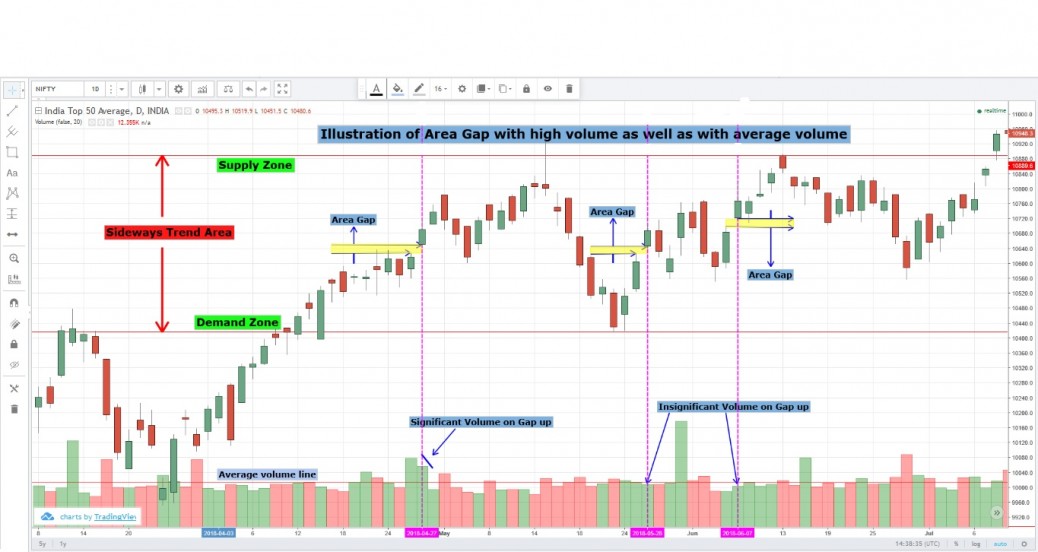
Nifty top 50 chart is taken up for identifying GAP analysis. It is seen NIFTY top 50 has been trending sideways from April 2018 to July 2018.
In the enclosed chart range of sideways are identified and marked accordingly.
Within this sideways, number of GAPs are identified and marked. Totally three GAPs are identified First GAP is with high volume and subsequent two GAPs have insignificant volume. For the purpose of distinguishing high volume and below average volume, a horizontal line is marked at volume range which is self-explanatory.
All the three GAPs occurred while upward trending within the sideways range. The GAP indicates strong demand and weak selling which is temporary in nature. These gaps are filled in subsequent trades.
Normal
0
false
false
false
EN-IN
X-NONE
X-NONE


