
Company: Bharat Forge Limited
Chart type: Candlestick
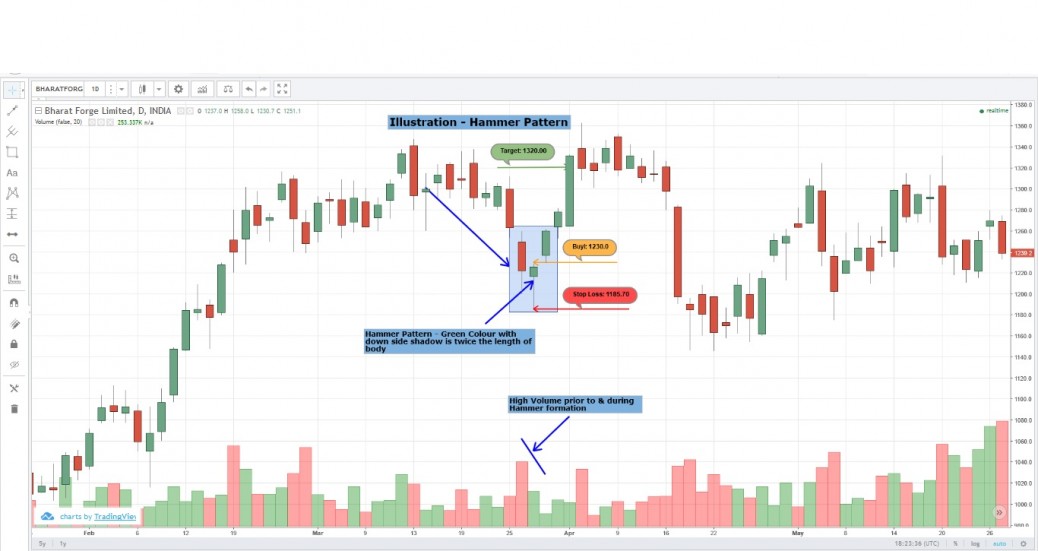
Hammer type Candlestick is one of the Bullish trend reversal pattern, occurs at the end of downtrend. Hammer like shape is seen in the chart. Its tail end should be double the size of the candlestick body.
Enclosed is the chart displaying ‘Hammer” pattern and it does qualify so.
1. *Candle prior to hammer shaped candle has stronger Bearish character with high volume displaying long candle. It has Pushed the price to substantially lower level.
* * On the day of occurrence of “Hammer” pattern, the price opened below closing level previous bearish candle indicating continued strong Selling pressure. The price has moved further deep down and eventually moved upward above the opening price reflecting return of Demand/Bullish force with GREEN Candle. It may be seen that length of shadow at lower end of the body is more than twice the size of candlestick body. Though there is shadow spurt above the Candle body, the same is ignored due to its insignificant length. The completed pattern looks like ‘Hammer”.
3. * Though Hammer pattern shows revival of demand, traders wait for next day’s Bullish signal. Candlestick next to ‘Hammer candle’ confirms this signal on next day with opening price higher than the closing price of hammer Candle.


