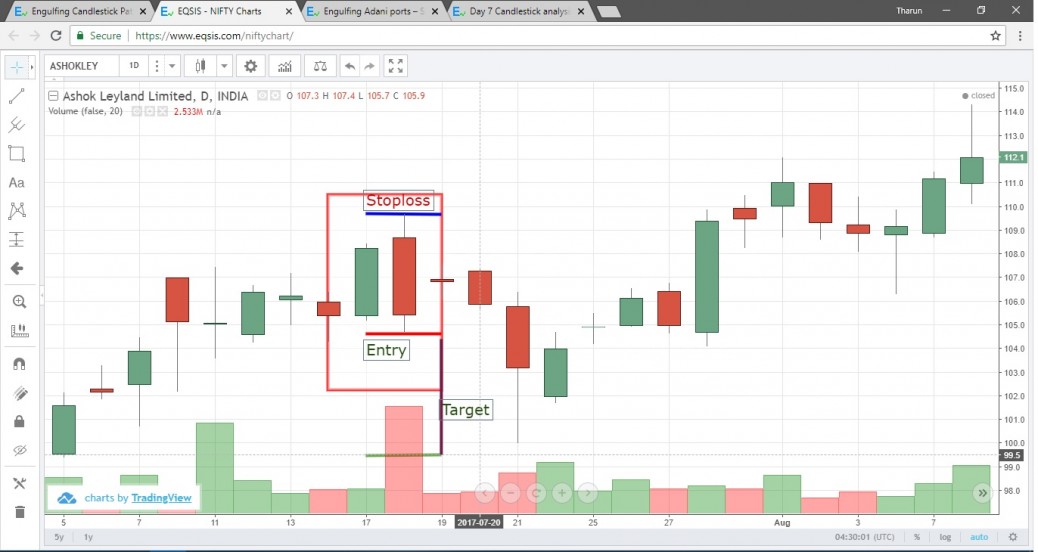
In this Chart we are able to see the next day body is covering the previous day body completely and the volume is high at the engulfing body. Its happened within 2 days and the sellers are more aggressive during the trade, so its a Bearish Engulfing Candlestick Pattern.
Ashok Leyland- Bearish Engulfing
feel free to call us +919500077790 info@eqsis.com
0 Comments
Stock Analysis
M | T | W | T | F | S | S |
---|---|---|---|---|---|---|
1 | 2 | 3 | 4 | 5 | ||
6 | 7 | 8 | 9 | 10 | 11 | 12 |
13 | 14 | 15 | 16 | 17 | 18 | 19 |
20 | 21 | 22 | 23 | 24 | 25 | 26 |
27 | 28 | 29 | 30 | 31 |
Bullish View
Bearish View
- Bearish-GAP-SHORT-BICON-25-10-2019 October 25, 2019
- FEDERAL BANK – BEARISH ENGULFING October 17, 2019
- Cummins India – Bearish Engulfing – 24Sep19 September 25, 2019
- Day29-Tata Motors DVR – Bearish Piercing – 12Sep19 September 12, 2019
- Day27-Bearish-Engulfing pattern-Tech Mahindtra-09Sep19 September 10, 2019
How this forum help stock traders?
Stock Trading is business, the success depends not just on capital or subscribing advisory services or participating workshops. The factors such as your awareness level about business, Efforts and your contributions, Smartness, Knowledge in analysis and trading instrument, availability of infrastructure and emotional control determine your success.