
In this chart the concept of Hammer pattern is described by applying the same on the company ‘Sundaram Finance Ltd’, wherein the shape of the Hammer is formed during the period of May 2017.
The Hammer pattern which is a very powerful tool to analyse the movement of share prices, is formed only if it satisfies the following criteria :
1. The Hammer lower tail should be minimum two times of it’s body size.
2. The Hammer should be green in color.
3. The upper tail should be invisible or very small in size.
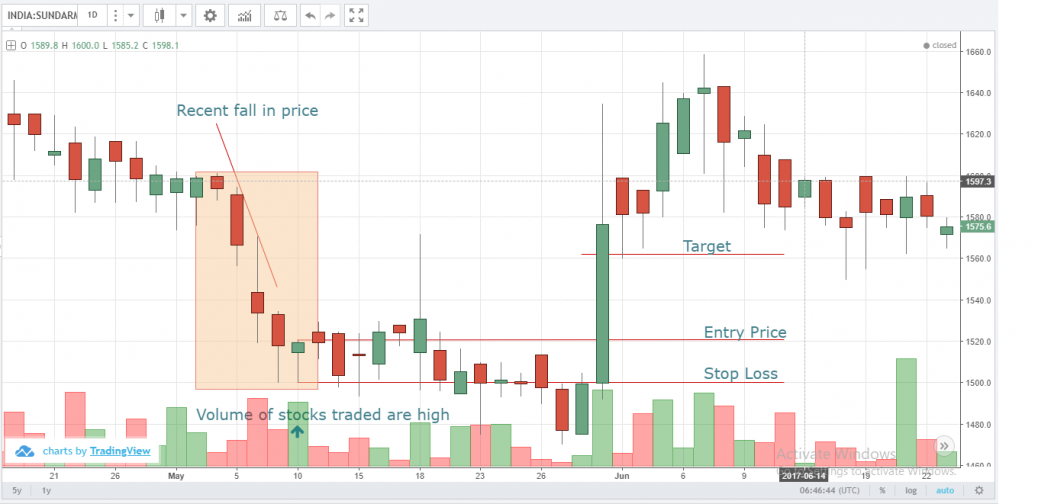
4. The volume of stocks traded during the period of Hammer taking shape should be high.
Thus in line with the above theory, it was noticed that the formation of Hanging man took place on 10.05.2017, after which there has been a gradual rise in the prices of the stock. Since there appears to be a bullish outlook for the stock, the position to be taken by the trader is long. The trader is advised to buy the stock at the above shown entry price in the chart, and set the stop loss at the lowest level. On account of Hammer pattern, the target price is set considering twice the risk taken by the trader, therefore, the target price has been accordingly calculated.


