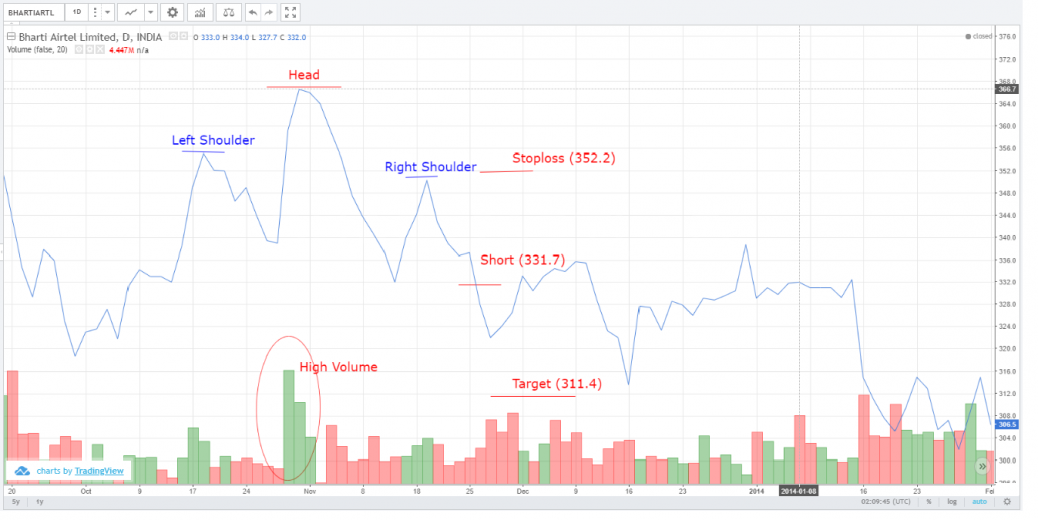
Identified the Head which is High Top with two lower tops by both left and right side. In left top, volume is high and there is low volume in right top. Pattern formed in one month duration and it goes down and hit the target. Mentioned below the price details.
Bharti Airtel Limited – Head and Shoulder Pattern
feel free to call us +919500077790 info@eqsis.com
Stock Analysis
M | T | W | T | F | S | S |
---|---|---|---|---|---|---|
1 | 2 | 3 | 4 | 5 | 6 | 7 |
8 | 9 | 10 | 11 | 12 | 13 | 14 |
15 | 16 | 17 | 18 | 19 | 20 | 21 |
22 | 23 | 24 | 25 | 26 | 27 | 28 |
29 | 30 |
Bullish View
Bearish View
- Bearish-GAP-SHORT-BICON-25-10-2019 October 25, 2019
- FEDERAL BANK – BEARISH ENGULFING October 17, 2019
- Cummins India – Bearish Engulfing – 24Sep19 September 25, 2019
- Day29-Tata Motors DVR – Bearish Piercing – 12Sep19 September 12, 2019
- Day27-Bearish-Engulfing pattern-Tech Mahindtra-09Sep19 September 10, 2019
How this forum help stock traders?
Stock Trading is business, the success depends not just on capital or subscribing advisory services or participating workshops. The factors such as your awareness level about business, Efforts and your contributions, Smartness, Knowledge in analysis and trading instrument, availability of infrastructure and emotional control determine your success.
Sir,
I am not able find the pattern with 3 months duration but found the head and shoulder pattern with 1 month duration and uploaded the same. Could you please correct me if it is incorrect.
Also, i took more than 30 charts and unable to find the pattern. Could you please tell me in which company chart i can see the head and shoulder pattern with 3 months duration.
Thanks & Regards,
Nirmal Kumar J