
Technical indicator moving average works during trending and may not work during sideways. It indicates the trend with the...
Dow theory is a Study about the Stock Price Direction on Time vs price scale.It helps in knowing the...
Demand & Supply drives the stock price. Fundamental and Technical analysis are two main type of analysis which helps...
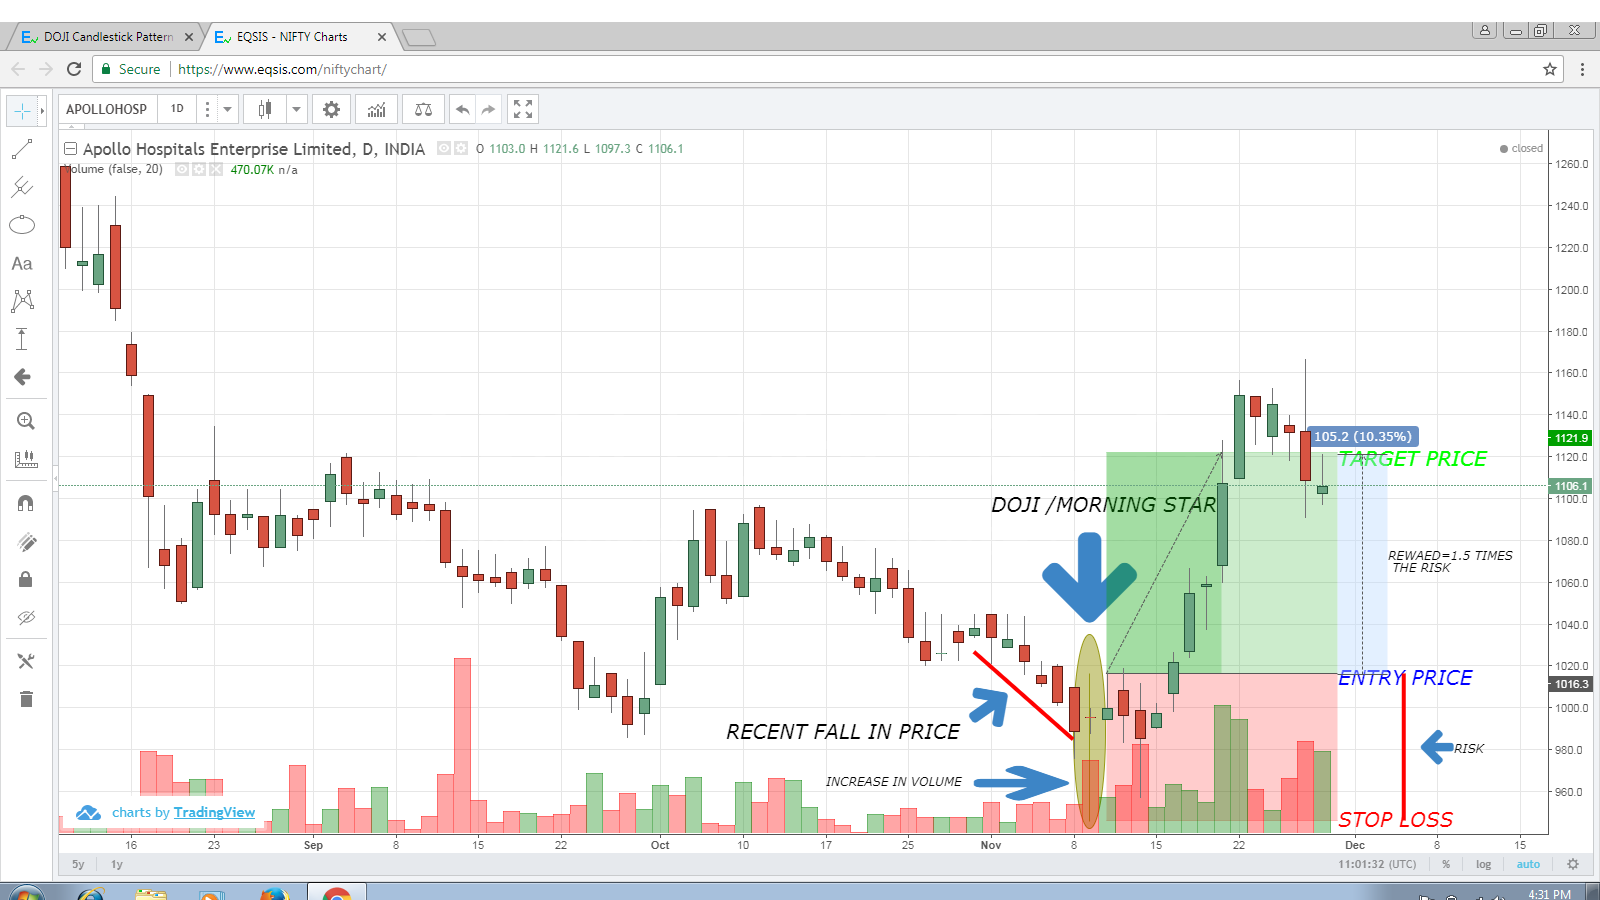
APOLLO-BULLISH DOJI ENTRY PRICE: RS.1016 STOPLOSS: RS.946 TARGET PRICE: RS. 1121 DURATION: 10 DAYS
technical indicators eases out the life of a trader with the available indicators we can create long or short...
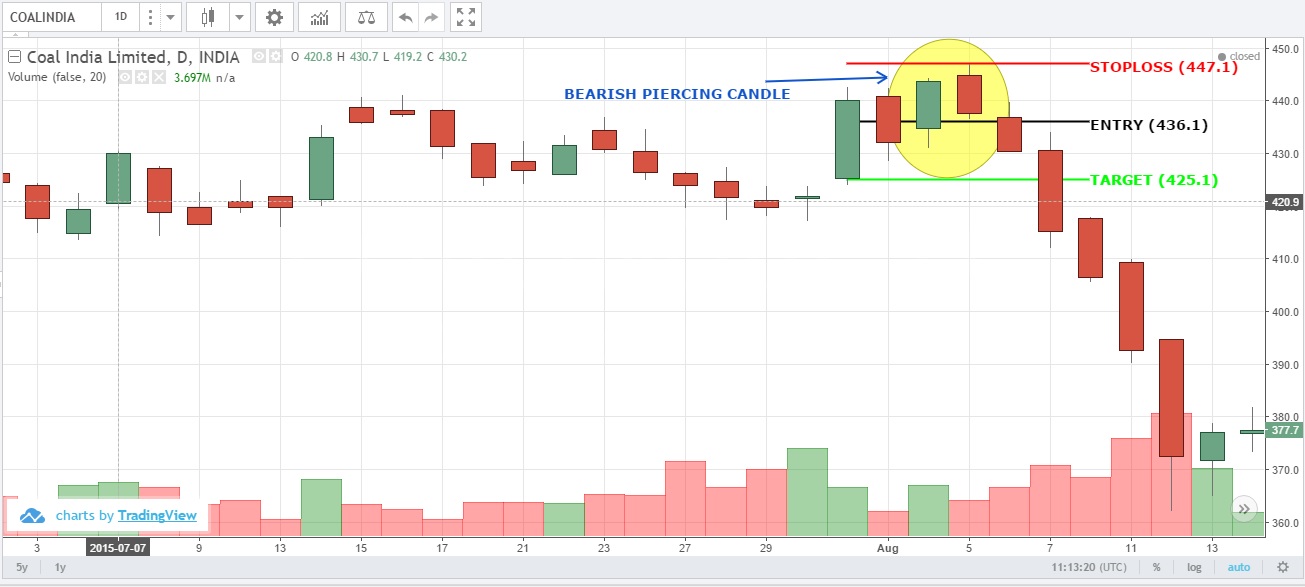
Enter the trade after price goes down below the low of 2nd candle on 3rd day.
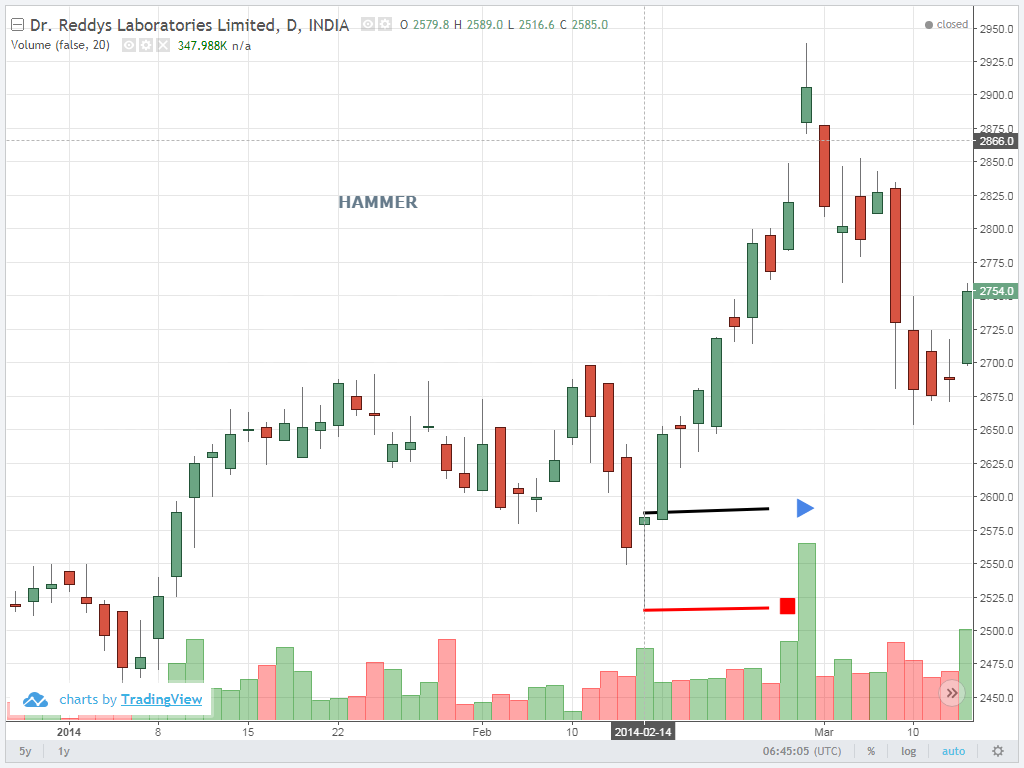
Entry point is when the price goes above the highest of the hammer, stop loss is lowest of the...
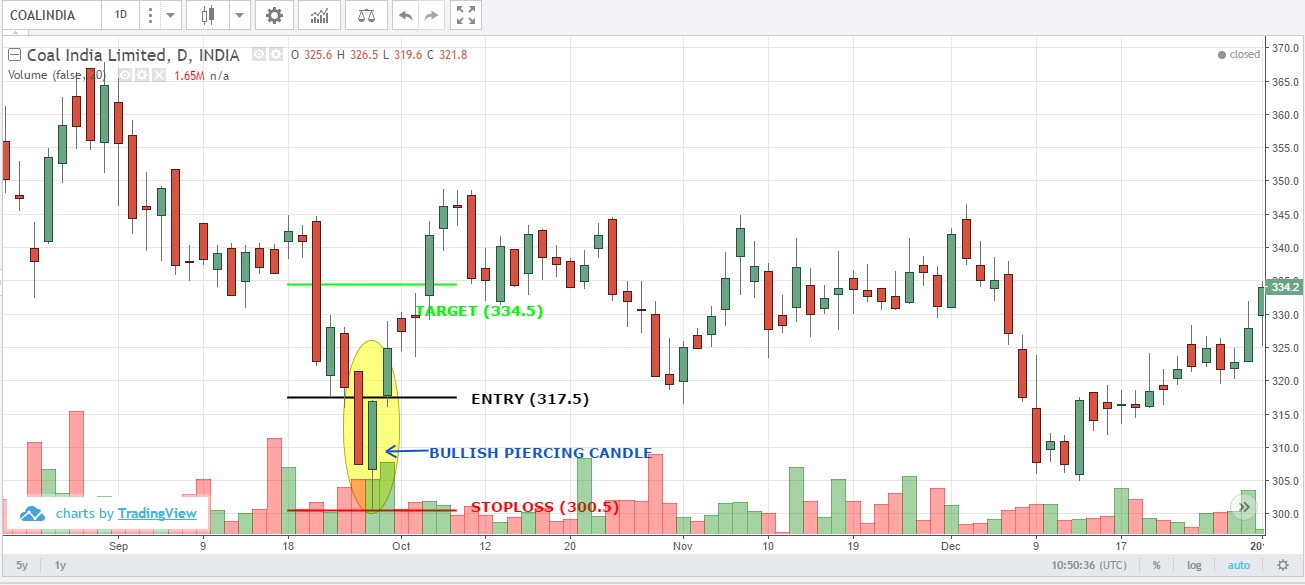
Enter the trade when price moves above the high of the 2nd candle. Entry- 317.5 Target - 334.5 Stoploss - 300.5
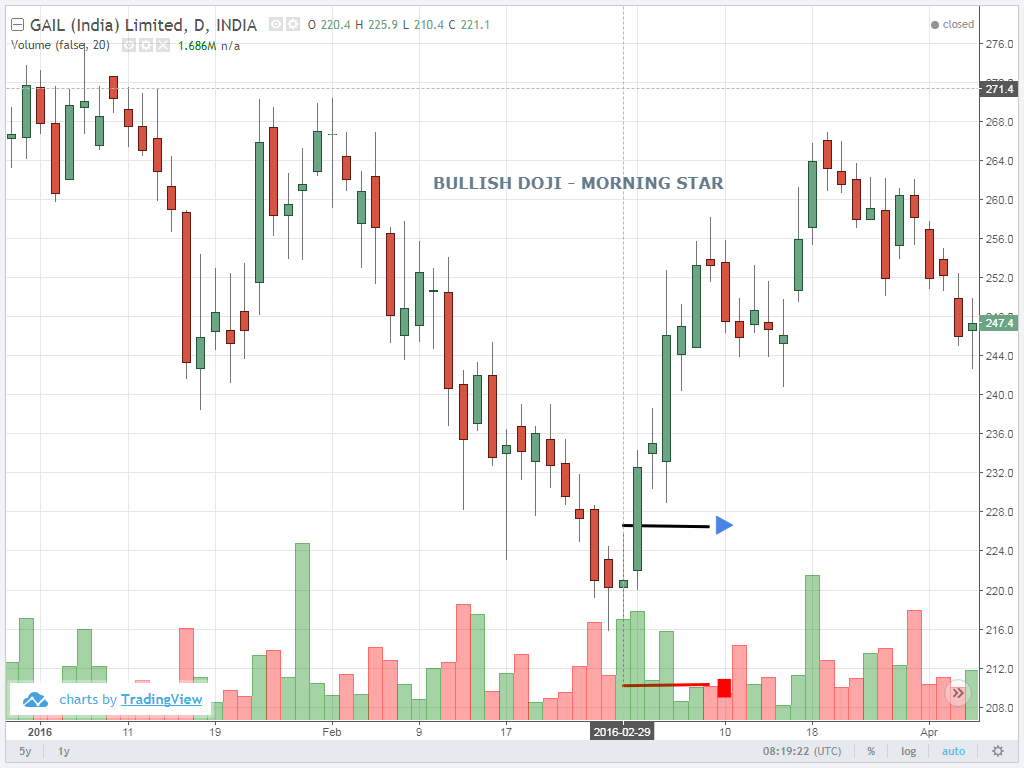
Entry point is doji high, stop loss is doji low & target is equal to stop loss.
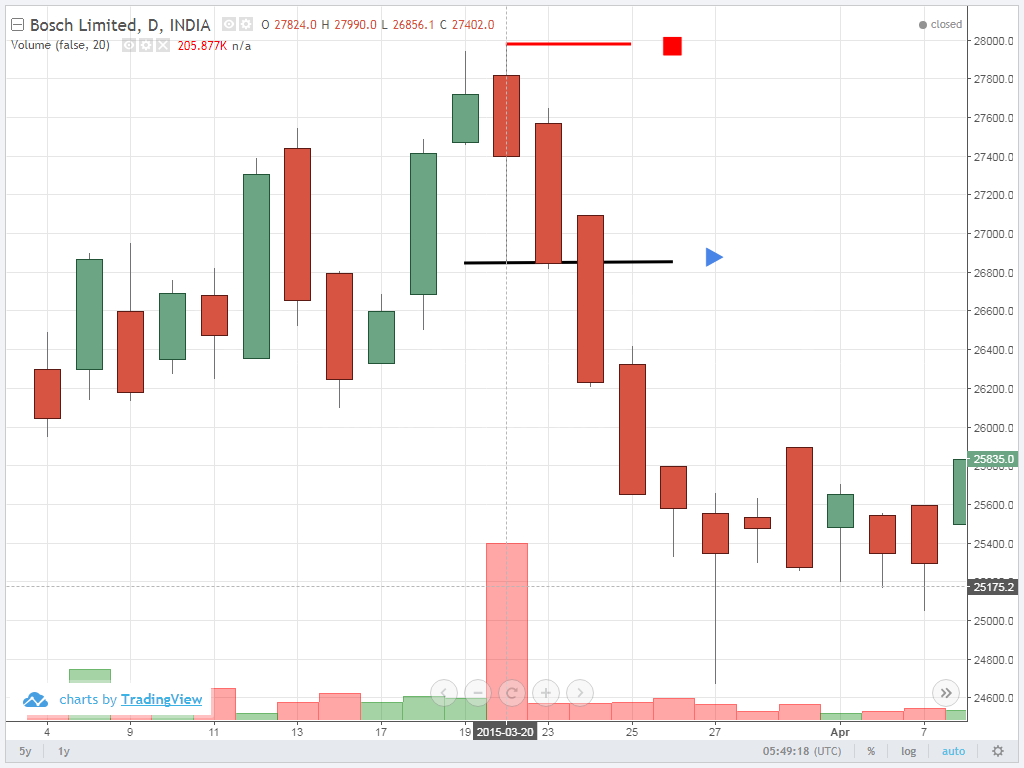
THE CONSTRUCTION – ENGULFING CANDLESTICK PATTERN [ BOSCH – BEARISH TREND ]
Entry point is below the latest candles low, Stop loss is latest candles high & target is equal to...
Recently Active Members
Bullish View


Bearish View
-
 Bearish-GAP-SHORT-BICON-25-10-2019 October 25, 2019
-
 FEDERAL BANK – BEARISH ENGULFING October 17, 2019
-
 Cummins India – Bearish Engulfing – 24Sep19 September 25, 2019
-
 Day29-Tata Motors DVR – Bearish Piercing – 12Sep19 September 12, 2019
-
 Day27-Bearish-Engulfing pattern-Tech Mahindtra-09Sep19 September 10, 2019