

How Much To Pay?
Financial history has consistently shown that immense wealth in the stock market has not been created solely by identifying which economy will grow the fastest, or even by predicting which industry will capture the largest market share. More specifically, it hasn’t been just about spotting companies likely to sustain profitable growth in the future.
While identifying a great company is certainly important, it’s only one part of the equation. The other—equally crucial—part is buying that great company at a great price. History teaches us that paying the right price for an asset has no substitute.
Valuing a business is, and always will be, an integral part of analyzing a company. In this section, we’ll explore a simple and elementary valuation framework that investors can use to begin their journey of evaluating and valuing businesses effectively.
A Few Words on Traditional Metrics
The investment community often relies on various traditional valuation metrics such as Price to Earnings (P/E), Price to Book (P/B), and Price to Earnings Growth (PEG) to quickly gauge a business’s valuation. However, these metrics are more like valuation shorthand’s—they offer quick insights but come with many blind spots that can lead to distorted long-term investment decisions.
So, how do we overcome this?
Instead of creating new valuation metrics, we’ll focus on learning two simple frameworks that can help investors get ahead in their analysis. The best part? These frameworks are easy to understand—even if you have zero background in finance.
Valuation Frameworks
-
Break-Even Analysis
-
Probabilistic Valuation
These two valuation frameworks are interconnected, and we’ll explore how they complement each other in practice.
Break-Even Analysis
Let’s first understand what break-even means through a simple example.
Suppose a company generates an annual revenue of ₹100 crores and a net profit of ₹5 crores. Now, imagine you decide to buy the entire company for ₹25 crores.
Since you’ve invested ₹25 crores into the business, you’re interested in knowing how long it will take for the company to earn enough profit such that the cumulative profit equals or exceeds your investment.
Assuming the company continues to generate ₹5 crores in net profit every year, it would take 5 years to accumulate ₹25 crores in total profit. Therefore, 5 years is your break-even period—the time it takes to recover your initial capital of ₹25 crores if the business performs consistently.
Sophisticated Example:
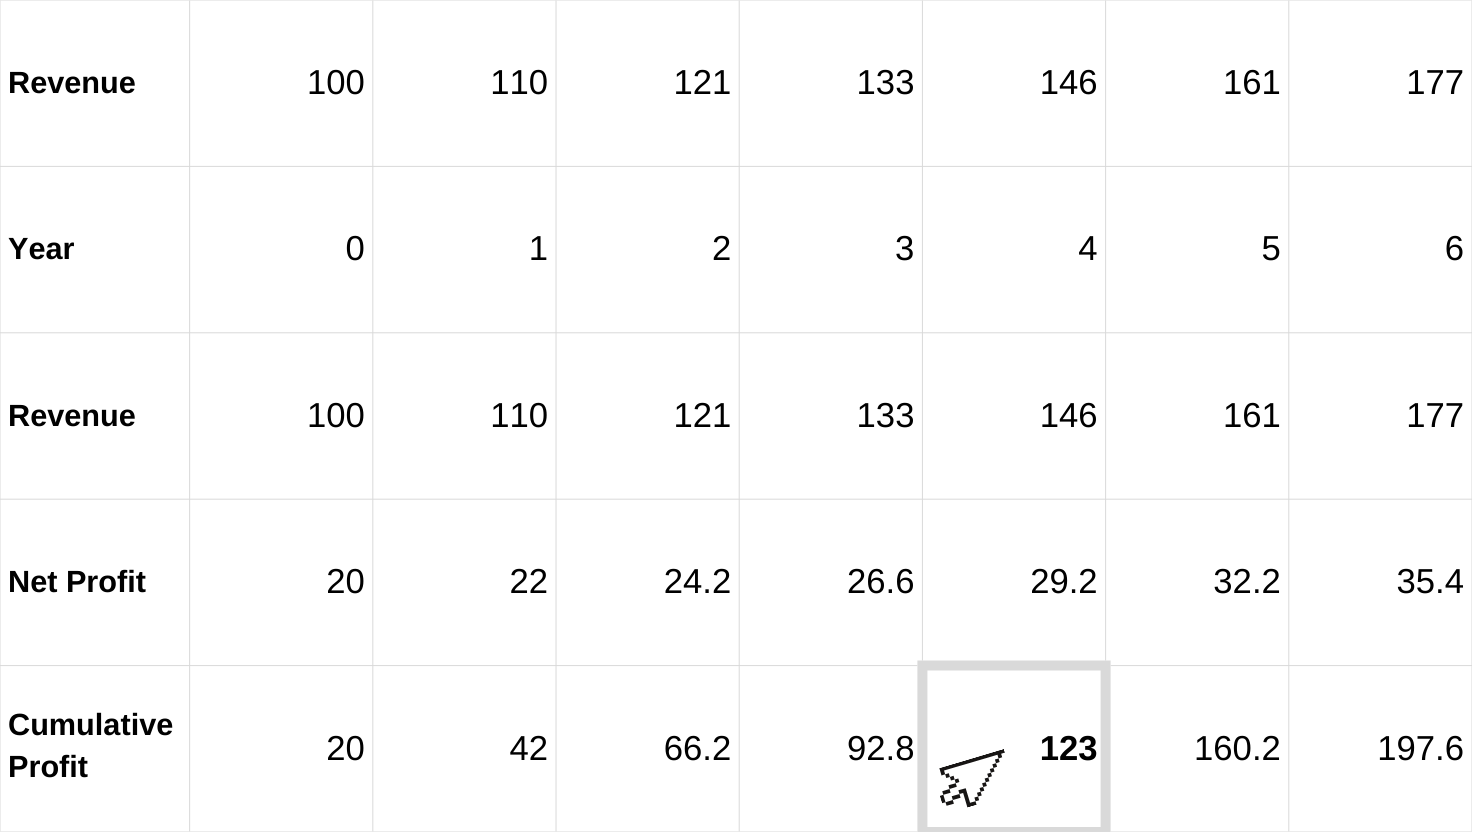
A company with a market capitalization of ₹120 crores generates an annual revenue of ₹100 crores and a net profit of ₹20 crores. It is expected to grow its revenue and net profit at a 10% CAGR over the next five years.
We want to calculate the break-even time.
The table below shows the estimated results based on the initial conditions.
By the end of the fourth year, the total cumulative profit (₹123 crores) exceeds the initial investment of ₹120 crores. Therefore, the break-even time is 4 years.
Introducing the Concept of Time Value of Money (TVM)
The Time Value of Money (TVM) is the principle that money available today is worth more than the same amount in the future. This concept is fundamental in understanding real investment returns.
In our earlier example, we estimated the break-even point to be 4 years—meaning we recover our original capital of ₹120 crores in that time. However, due to the time value of money, ₹120 crores today is worth more than ₹120 crores received 4 years from now.
How to Calculate TVM?
The formula for calculating the future value (FV) is:
FV = P × (1 + r/100)ⁿ
Where:
-
FV = Future Value (what we want to calculate)
-
P = Present Value (in our case, ₹120 crores)
-
n = Number of years (the break-even period)
-
r = Rate of return (in this case, the risk-free rate)
Why Use the Risk-Free Rate?
The risk-free rate represents the return on investment with no risk involved, typically the yield on government bonds (currently around 7.79%).
Equity investments are inherently risky. Therefore, any return below the risk-free rate implies that the investment has not adequately compensated for the risk taken. In simpler terms, if an equity investment is projected to return less than 7.79%, it’s not worth the risk and is effectively a worthless investment.
Now, when we recalculate the break-even point while considering the Time Value of Money, the result changes—and we get the updated table shown below.
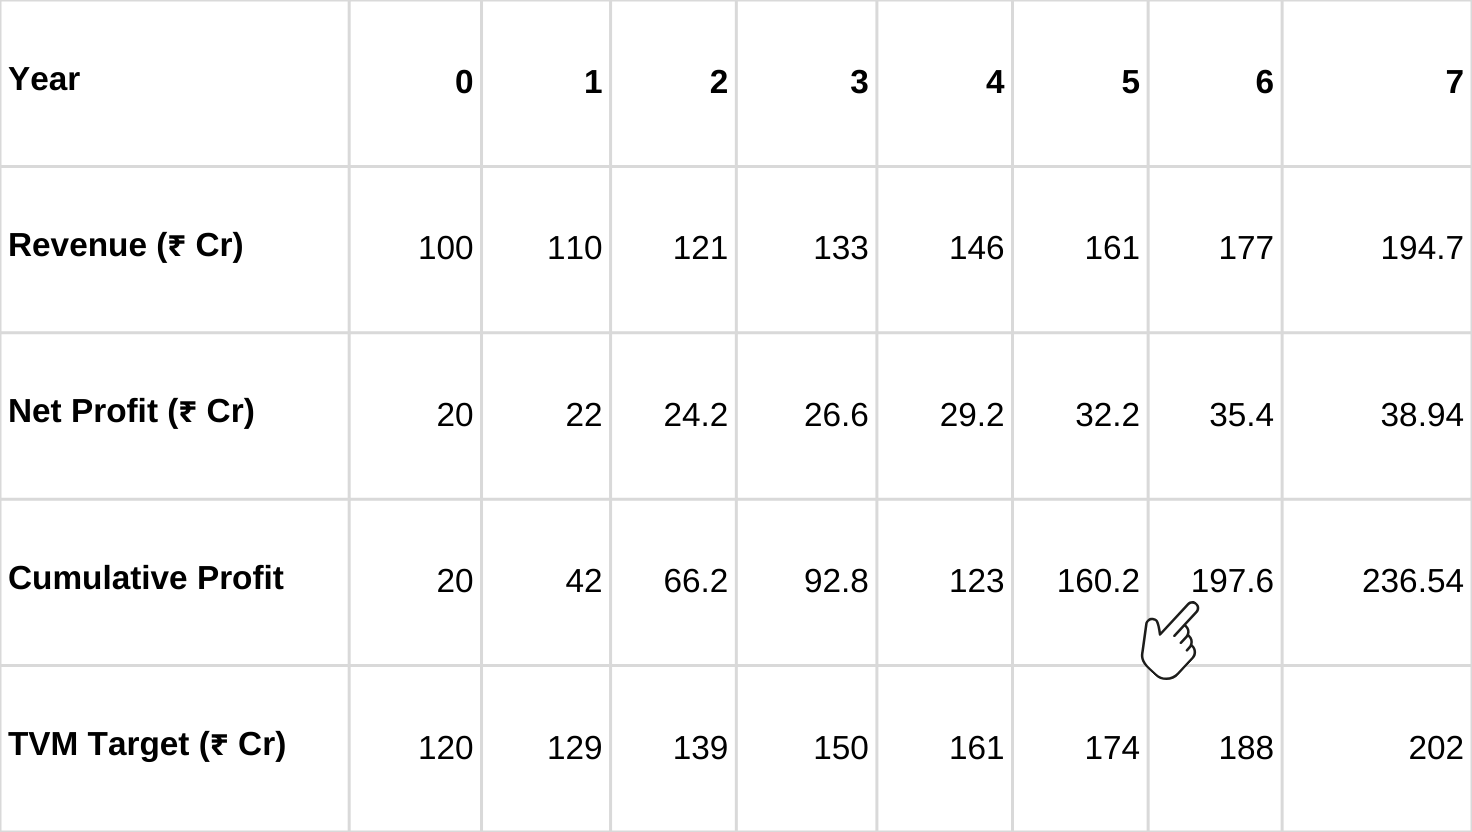
Our initial capital of 120 crores has grown to 188 crores in six years when adjusted to the ‘time value of money’.
From the table, we get that, at the end of the 6 years, the cumulative profit (197.6 crores) is greater than TVM (188 crores).
So, our ‘break-even’ time is 6 years. If we observe more closely, we might see that the break-even time was just 4 years (without considering TVM), and it is 6 years (with considering TVM).
This indicates that ‘thoughtful valuation’ must consider TVM in the valuation of the business.
Why Should Investors Care About ‘Break-even’ Time?
If the calculated break-even time is less than 5–7 years, then it is considered to be a good investment, and if the break-even time is higher than 10–15 years, then investments should be avoided.
So why 5–7 years only?
We have to be very conservative while calculating the break-even point because it is very difficult to calculate how much profit the company is going to generate in the very long run (10–15 years), because the company may have even gone extinct in this time frame due to various uncertainties.
Also, if the break-even point is 10–15 years, one has to wait 10–15 years to recover his original money, and on top of it, TVM also increases a lot.
But unfortunately, we cannot find many good investments having a break-even point of less than 5–7 years in the current market.
But having a ‘watchlist’ of investments will help the investors to take advantage of a falling market.
Probabilistic Valuation
Business works in uncertain environments, so it would be clever to think about the future in a ‘range of possibilities’ instead of defining accurate numbers.
In our example in ‘break-even analysis’, we have assumed that the company would grow its net profit by 10% CAGR for the next five years, but instead of defining a specific number, we can mention different outcomes and the probability associated with those outcomes.
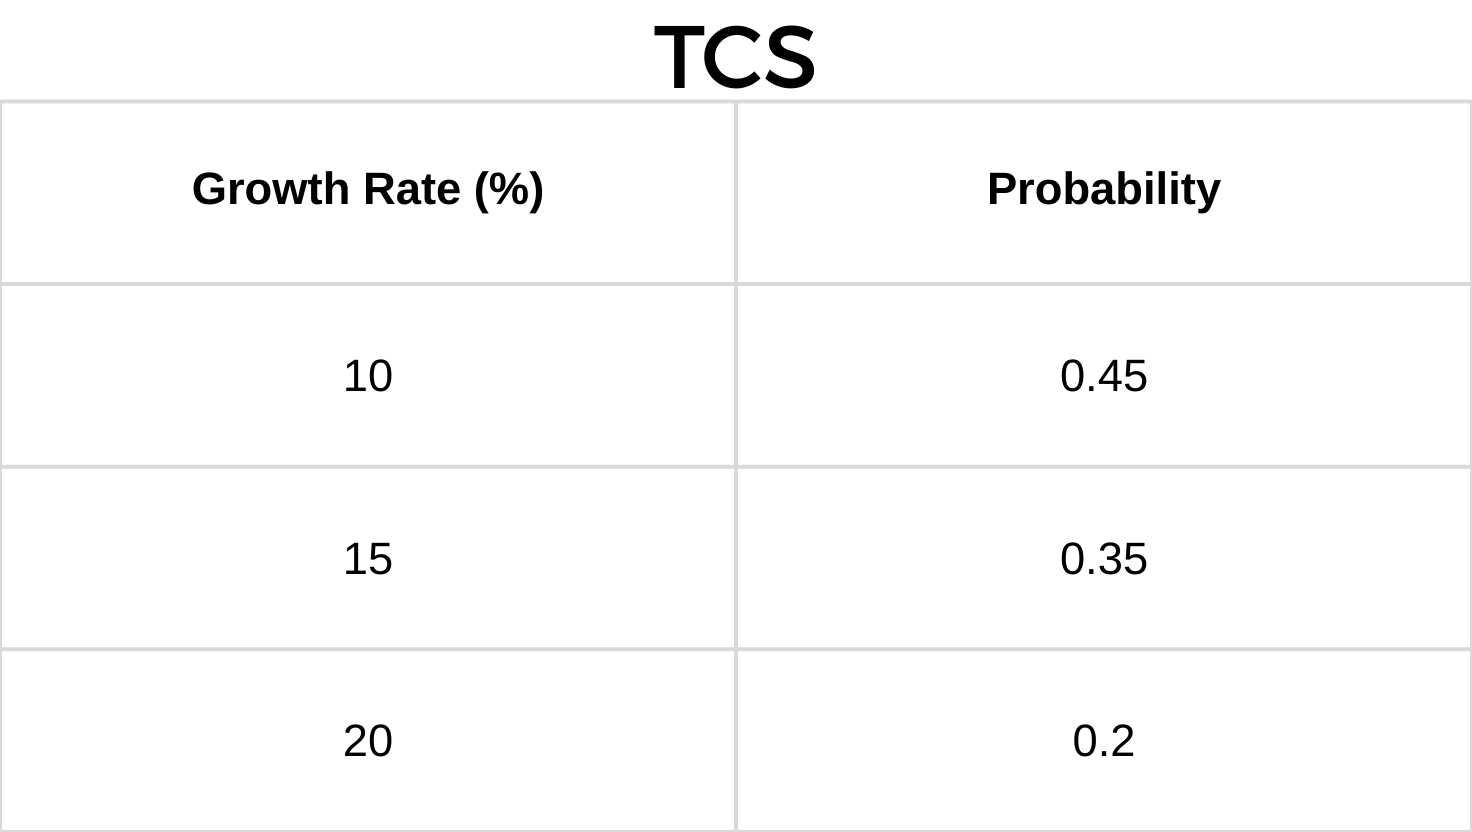
For example, instead of saying that the company is going to grow its net profit by 15% CAGR for the next five years, we can say that the company can grow at 15% CAGR and the probability for this happening is 35%, and has a probability of 45% for growing at 10% CAGR, and has the probability of 20% for growing at 20% CAGR for the next five years.
To summarize, see the table below:
Now we will introduce the concept of ‘Expected Value’.
Consider we are playing a game called an ‘unbiased coin toss’ (the probability of getting heads or tails in a given coin toss is ½ or 0.5). Now, the game is that we gain Rs 5 if heads face up and lose Rs 2 if tails face up during the coin toss.
If we play the game for 10 rounds, what is the ‘expected money’ we can get at the end of the game?
Expected value (money) can be calculated using the formula below:
Expected Value = (Gain × Probability of gain) + (Loss × Probability of loss)
So, as per our example:
EV = ( +5 × 0.5 ) + ( -2 × 0.5 ) = 1
So, the expected money we may earn at the end of one round is Rs 1.
Therefore, at the end of 10 rounds, we may earn Rs 10 (10 × Rs 1).
Now we can conclude by saying that the expected money one can earn at the end of 10 rounds will be Rs 10.
Coming back to our probabilistic valuation—
Since we are approaching the future growth rate of the business in a ‘range of probabilities’, it is necessary to calculate our expected value.
Now we can calculate the expected value as per our example.

We get our ‘expected growth’ rate to be 13.75% CAGR.
Now we can take this ‘growth rate’ of 13.75% as the base rate and construct the ‘break-even’ analysis described in our first framework to calculate the ‘break-even’ time.
Limitations and Mitigations
Limitations:
The ‘probabilistic valuation’ framework provides a more accurate result than the former framework, but the main problems are:
-
How many ‘ranges of outcomes’ should we consider?
-
How do we assign ‘probability’ to those outcomes?
Mitigation:
‘Ranges of Outcomes’
It is necessary to have at least three probable outcomes (low, medium, and high). The number of outcomes should not be increased merely for the sake of adding new outcomes, as this dilutes the essence of probability.
The ranges of outcomes should be updated periodically over time as we gather new information.
‘Assigning Probability’
Assigning probability is the trickiest part of this process. One should be conservative while assigning probabilities and avoid bias toward any particular outcome.
These probabilities should also be updated periodically as new information becomes available.
For example:
If we get information that the company is going to expand its business and start producing products next year, we should increase the probability of our ‘high growth rate’.
Conversely, if we receive information that the company is going to shut down its plants, we must increase the probability of the ‘lower growth rate’.
In this section, we have discussed in detail two broad elementary ‘frameworks’, which are just the first steps in analysis. These frameworks should be used alongside many other valuation frameworks such as DCF (Discounted Cash Flow), Free Cash Flow, etc., to gain better insights into the valuation of the company.
Conclusion
The Break-even and Probabilistic Valuation frameworks are just the beginning. Combine them with other tools like DCF, Free Cash Flow, etc., to gain better insights into a company’s valuation.
These frameworks are fundamental for investors looking to make informed decisions on their investments and ensure they are getting good value for their money.
A Quick Question
The market capitalization of TCS is Rs 6.8 lakh crores and it produces a net profit of Rs 28,759 crores. Now, consider the table below:
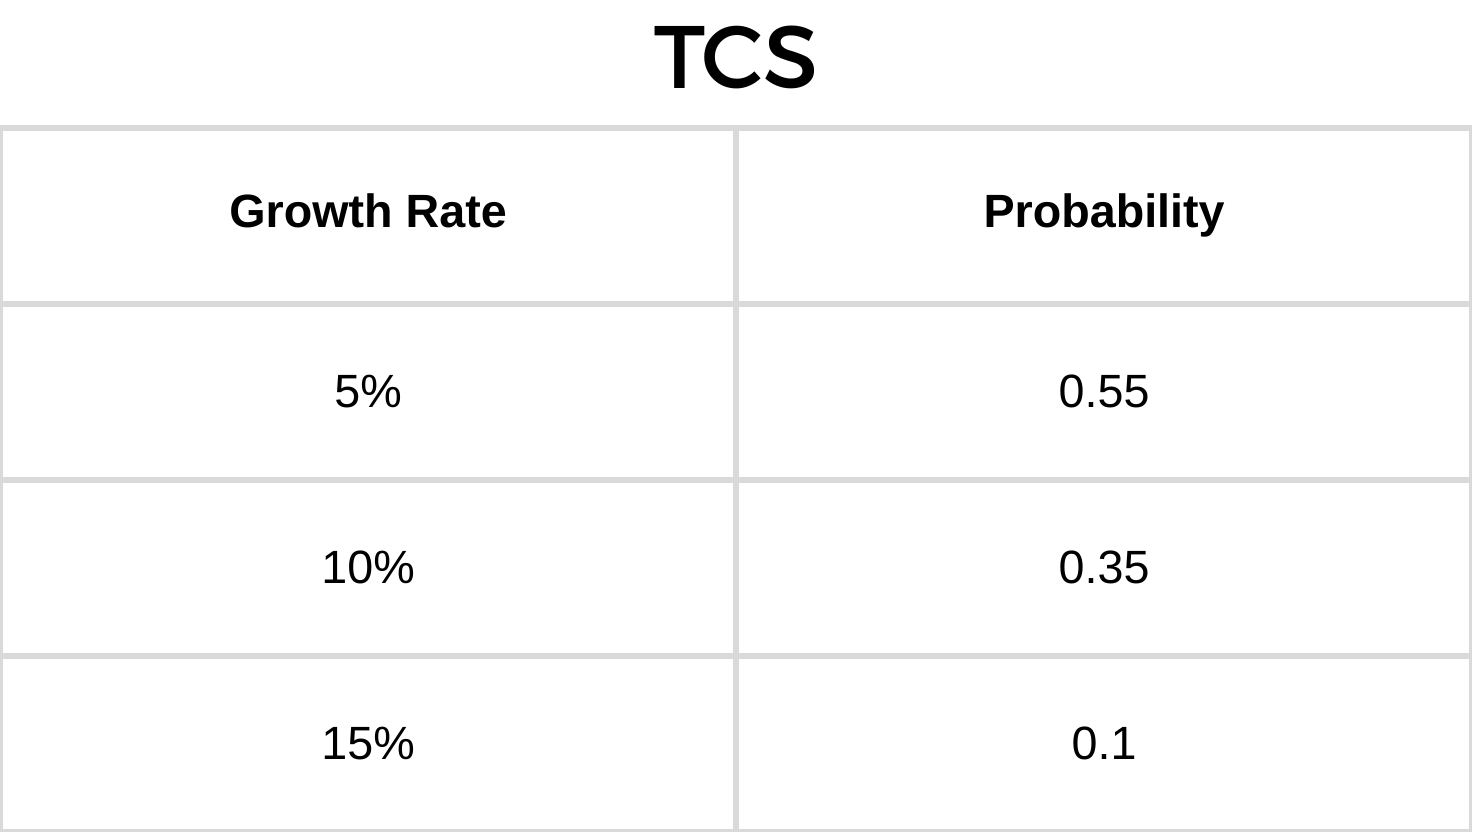
Calculate the ‘Break-even’ Time
Now consider that if the investor wants to earn a 15% CAGR over the next five years, find out whether TCS is suitable for his investments or not.
(This question is quite tricky, but if you have understood the above concepts completely, you should be able to answer it.)
Answers for both the questions will be shared in the upcoming post, so stay tuned.