
@vidhya86
-
Vidhya Edwin commented on the post, Bajaj Auto_Flag Pattern 4 years, 9 months ago
Thank you
-
Vidhya Edwin wrote a new post, Bajaj Auto_Flag Pattern 4 years, 9 months ago
Steeper Pole formed with sideways movement. Positive flag with positive breakout, volume is high at breakout. Entry Price – 2977Stoploss – 2881Target – 3093Long position can be created.
-
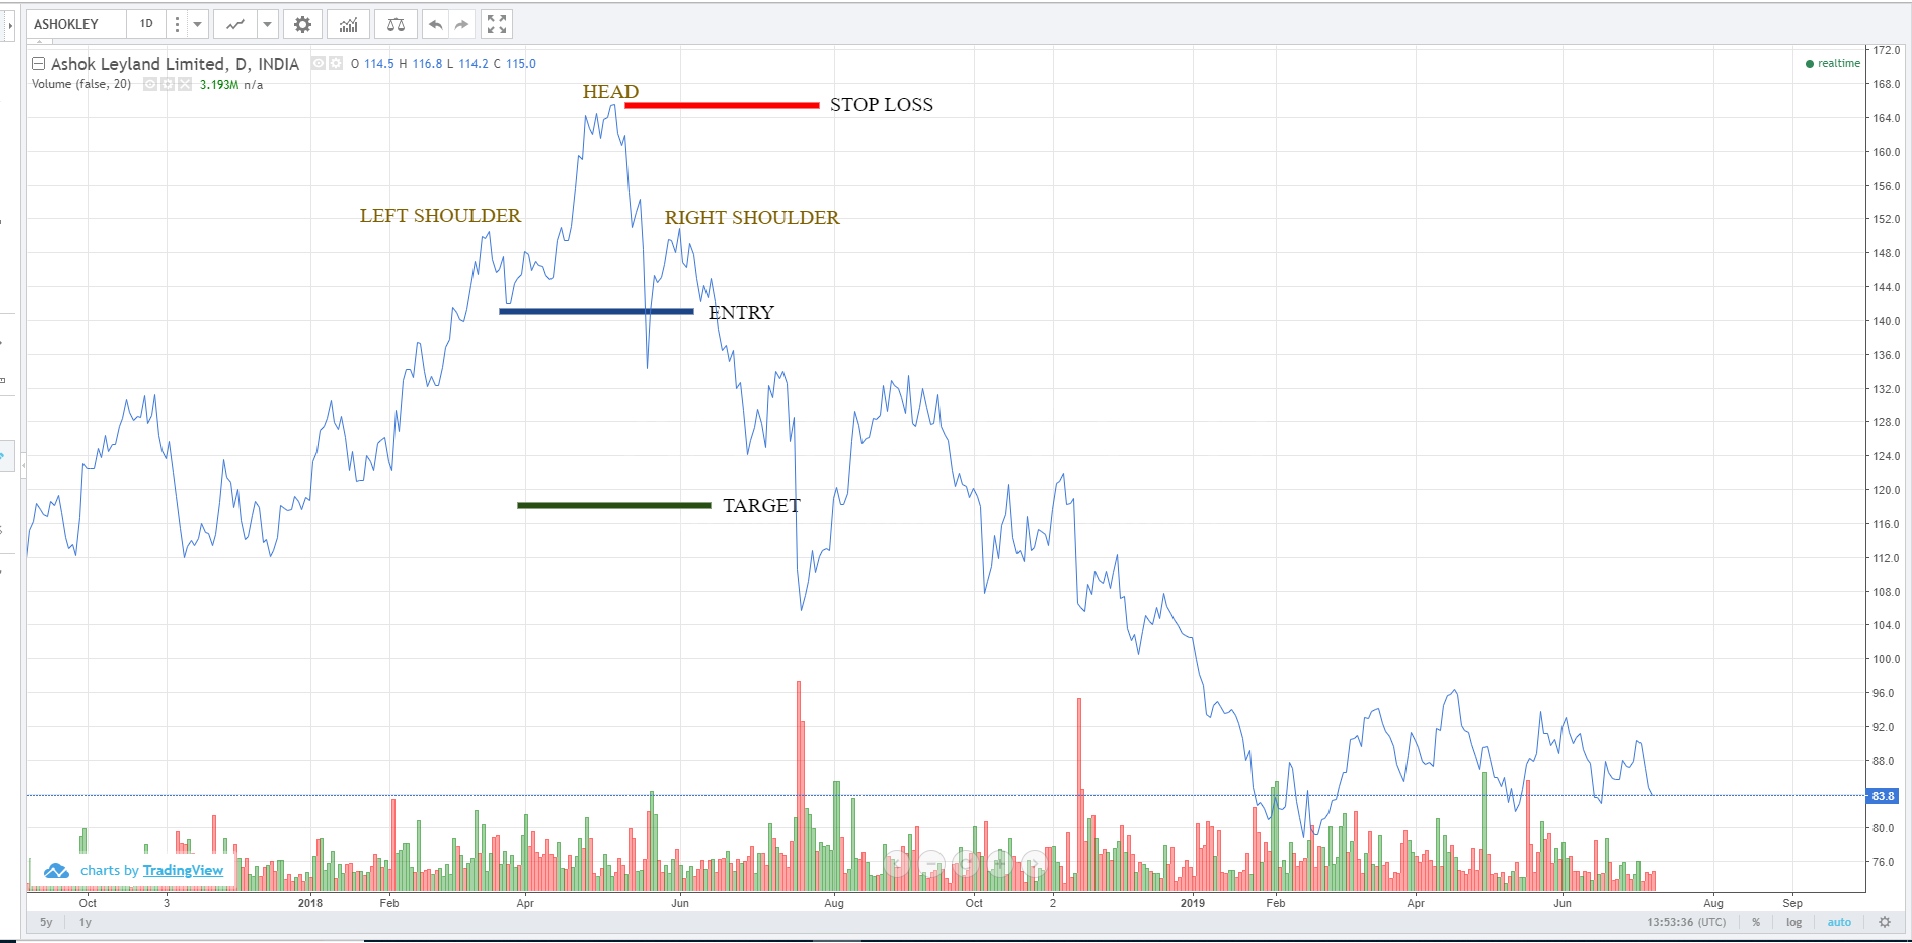
Vidhya Edwin wrote a new post, Head and Shoulder_Ashok Leyland 4 years, 9 months ago
Shoulder-Head-Shoulder formation. Volume is high at the left shoulder and low at the right shoulder. Duration is 3 months. Short position can be createdEntry price – 141.8Stop Loss – 165.4Target – 118.2
-
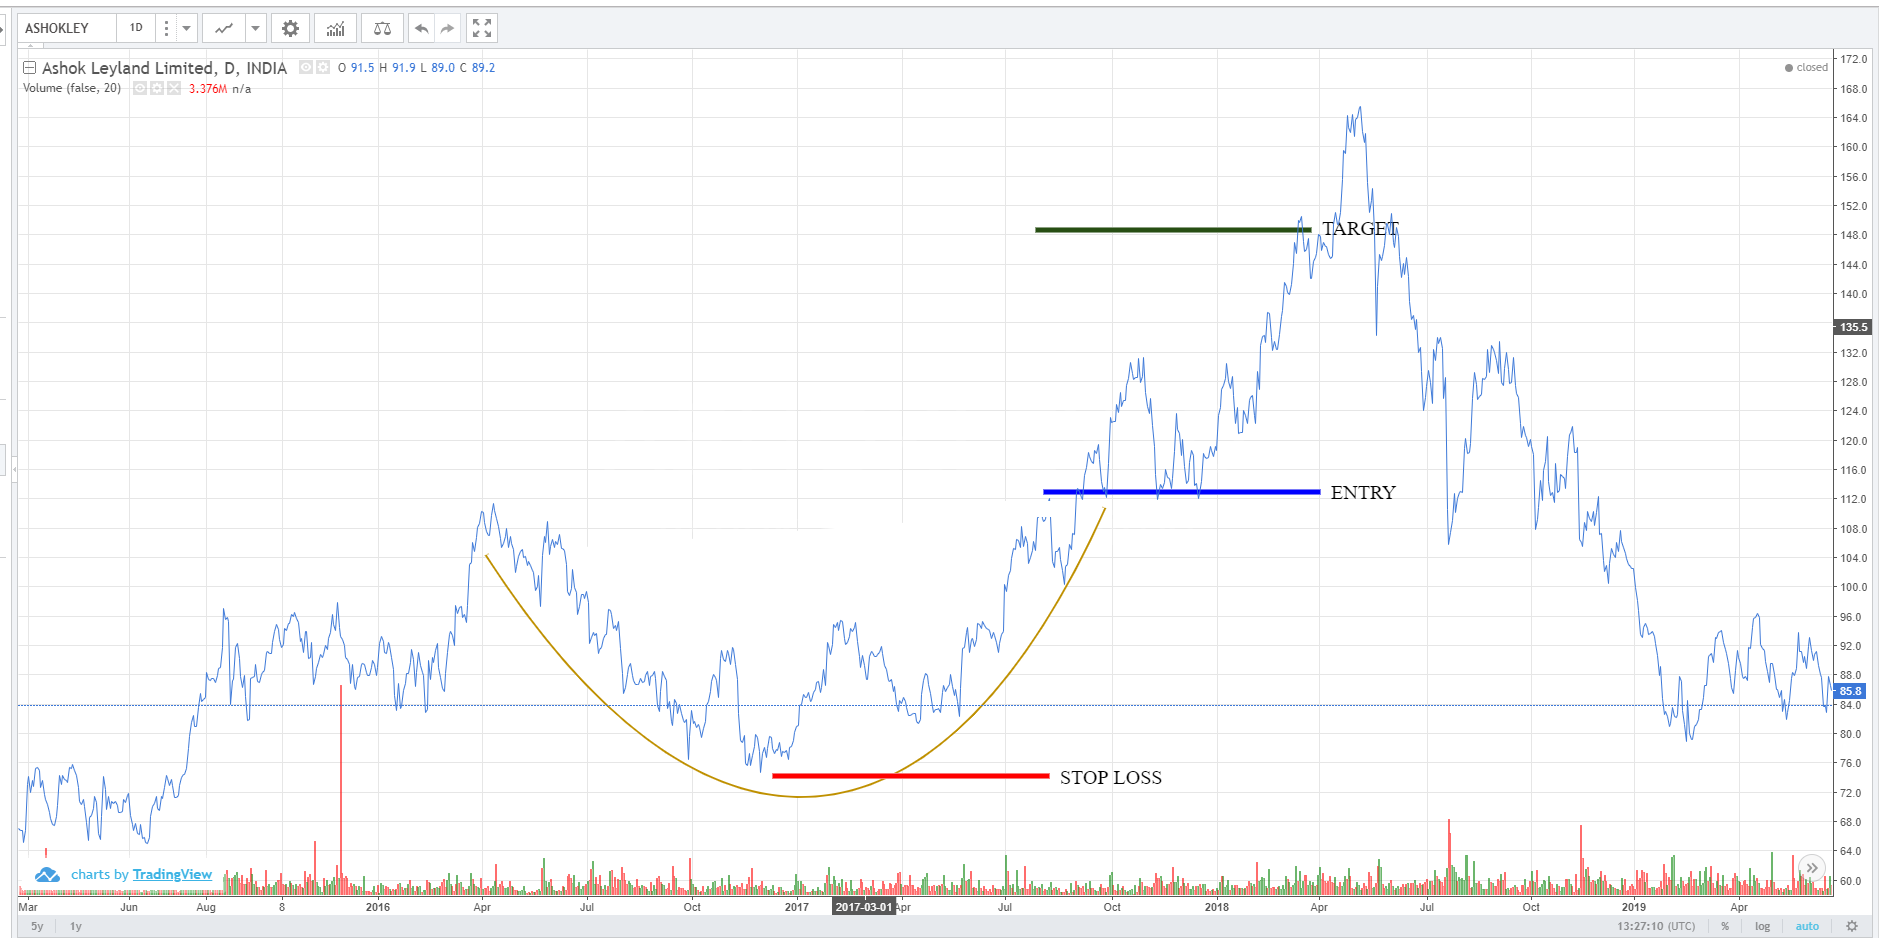
Vidhya Edwin wrote a new post, Cup Pattern_Ashok Leyland 4 years, 9 months ago
Cup pattern formed with a long duration of more than 1 1/2 years. Volume is low at the rounding bottom. Long Position to be createdEntry Price – 111.8Stop Loss – 74.8Target – 148.8
-
Vidhya Edwin commented on the post, Double Bottom_Adani Ports 4 years, 10 months ago
Thank you!
-
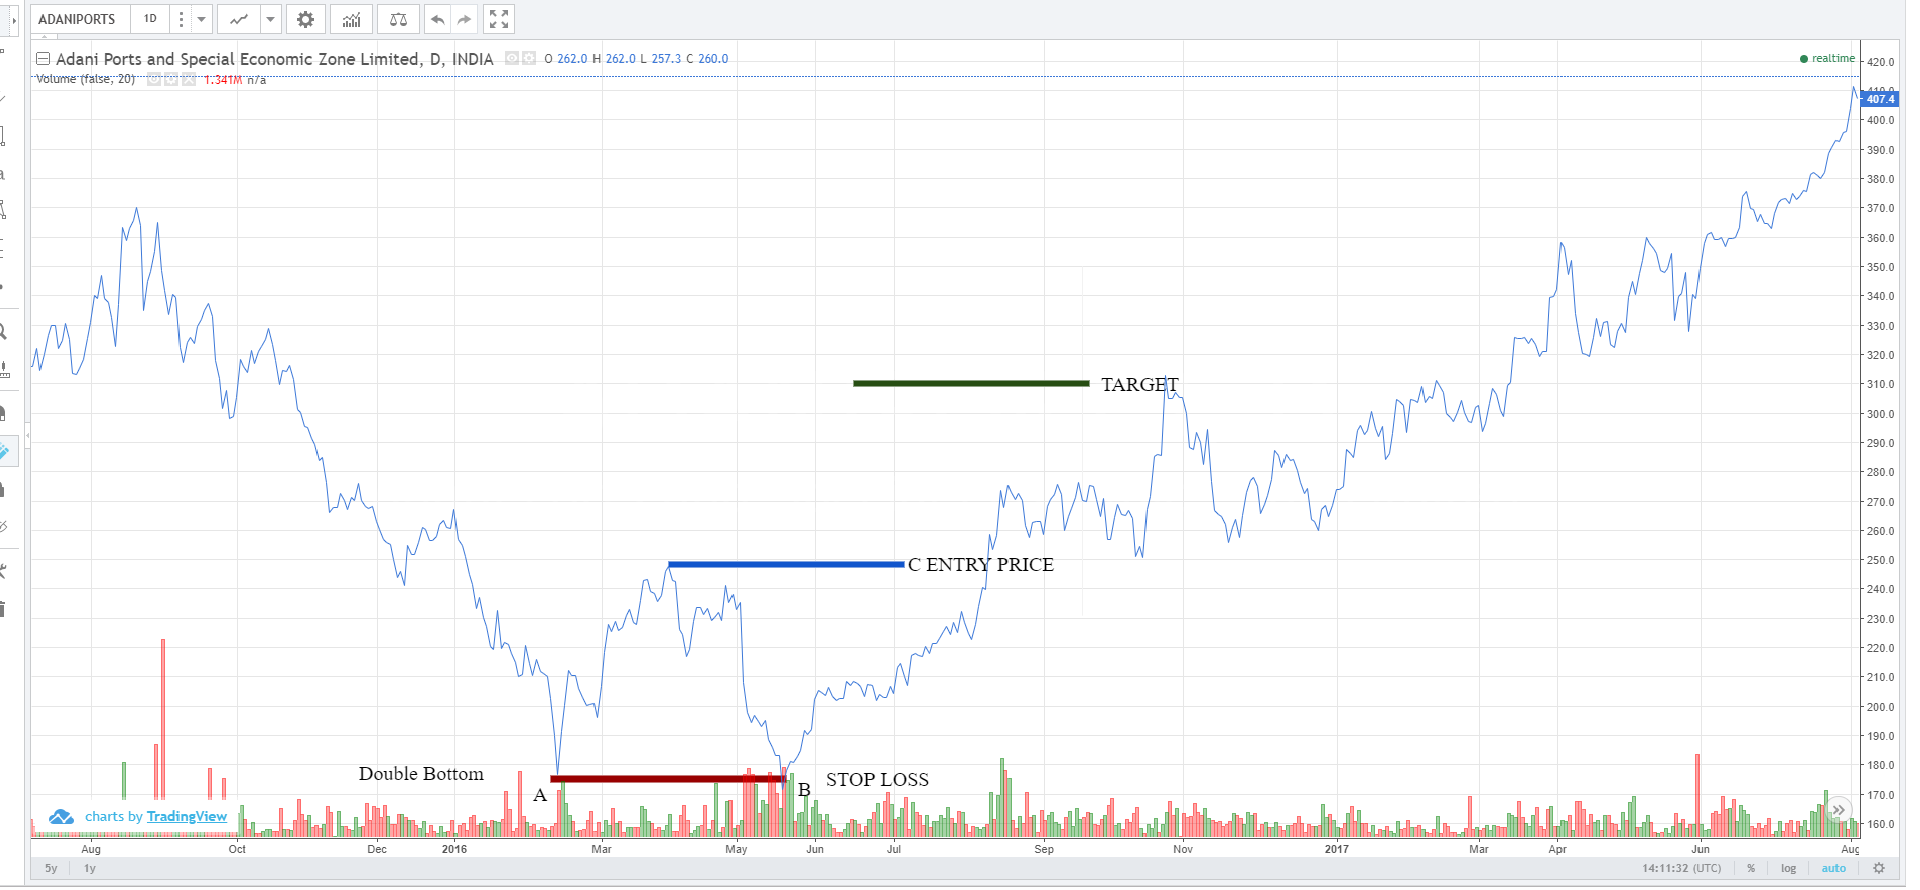
Vidhya Edwin wrote a new post, Double Bottom_Adani Ports 4 years, 10 months ago
2 Equivalent bottoms found with duration more than 20 days and high volume at point B & C. Long Position created
-
Vidhya Edwin wrote a new post, Double Top_Bharti Airtel limited 4 years, 10 months ago
2 Equivalent tops with duration more than 20 days found. Short Position Created
-
Vidhya Edwin commented on the post, ABB India Limited_DOW_Bullish 4 years, 10 months ago
Thank you!
-
Vidhya Edwin commented on the post, Asian Paint-Dow-Bearish 4 years, 10 months ago
Thank you!
-
Vidhya Edwin wrote a new post, ABB India Limited_DOW_Bullish 4 years, 10 months ago
High Bottom – High Top Sequence observed with high volume- Bullish TrendLong Position Created
-
Vidhya Edwin wrote a new post, Asian Paint-Dow-Bearish 4 years, 10 months ago
Lower Top – Lower Bottom Sequence observed with high volume so Short Position Created
-
Saravanan Jothivengadam and
Vidhya Edwin are now friends 4 years, 10 months ago
-

EQSIS and
-
Vidhya Edwin commented on the post, Candlestick Analysis 4 years, 10 months ago
Thank you!
-
Vidhya Edwin wrote a new post, Intraday Analysis 4 years, 10 months ago
Analysis to know the market position and price movement to buy or sell the stock to make profit on the same day is Intraday Analysis.
-
Vidhya Edwin wrote a new post, Technical Indicator 4 years, 10 months ago
Technical indicators are set of algorithms which can be a used to indicate price movement.
Moving Average is a trending zone indicator
RSI- Relative strength Index is a non trending zone indicator
-
Vidhya Edwin wrote a new post, GAP Analysis 4 years, 11 months ago
4 Types of GAP are:
Area Gap – This GAP Will appear inside the Trading Range
Breakout GAP – This GAP appear only when price give breakout from its trading Range.
Runaway GAP – This GAP appear post breakout -
Vidhya Edwin wrote a new post, Candlestick Analysis 4 years, 11 months ago
Candlestick Analysis is used to determine the short term trend.
Engulfing, Piercing, Doji, Hammer and Hanging man are candlestick patterns. -
Vidhya Edwin wrote a new post, Price Patterns 4 years, 11 months ago
Price patterns gives the characteristics of price movement in technical analysis. Some price patterns are Double top, Double bottom, Flag pattern, Triangle pattern, Cup Pattern, Head and Shoulder
-
Vidhya Edwin wrote a new post, Dow theory 4 years, 11 months ago
Dow Theory was derived by Charles H. Dow. This Theory uses the price and volume to identify the Demand and Supply zone. Higher bottom- higher top sequence gives bullish trend, lower top -lower bottom sequence
- Load More