
@k703
-
Allen wrote a new post, APOLLOHOSPITALS – DOUBLE BOTTOM – BULLISH 4 years, 10 months ago
” Equivalent ” Double bottoms are Identified as T1 and T2 and the duration is more than 20 days. Point A is marked as Entry point for Long position (1089.6). The stoploss is set at low of T2 which is Point B
-
Allen commented on the post, STOCK MARKET-1 4 years, 10 months ago
Cool Post.
-
Allen commented on the post, Raja day 1 4 years, 10 months ago
Hi Raja,
Well begun is Half done. Good start.
-
Allen commented on the post, BHARTIARTL – DOUBLETOP BEARISH 4 years, 10 months ago
Hi Mohan, Thank You Much.
-
Allen wrote a new post, BHARTIARTL – DOUBLETOP BEARISH 4 years, 10 months ago
The Equivalet Double tops with more than 20 days interval between each top was identified and marked as T1 and T2 respectively. After the double top pattern confirmed, The Entry point (short Position) was
-
Allen commented on the post, BANKBARODA – DOW – BEARISH TREND 4 years, 10 months ago
Hi,
Thank you.
I actually wanted to run this chart by you. Happy that you checked it. Cool and Thank You much. -
Allen commented on the post, ACC Limited – DOW THEORY – BULLISH TREND 4 years, 10 months ago
Thank you Sir.
-
Allen commented on the post, ASHOKLEYLAND – DOW THEORY – BULLISH TREND 4 years, 10 months ago
Thank You Sir,
-
Allen wrote a new post, BHARTIAIRTEL – DOW – BULLISH TREND 4 years, 10 months ago
After Identifying the HB to HT sequence, the Trend was confirmed as Bullish. The Entry point for Long position was made at point A (375.2), The Stoploss was the low of the Bottom, which is Point B(337.8) the
-
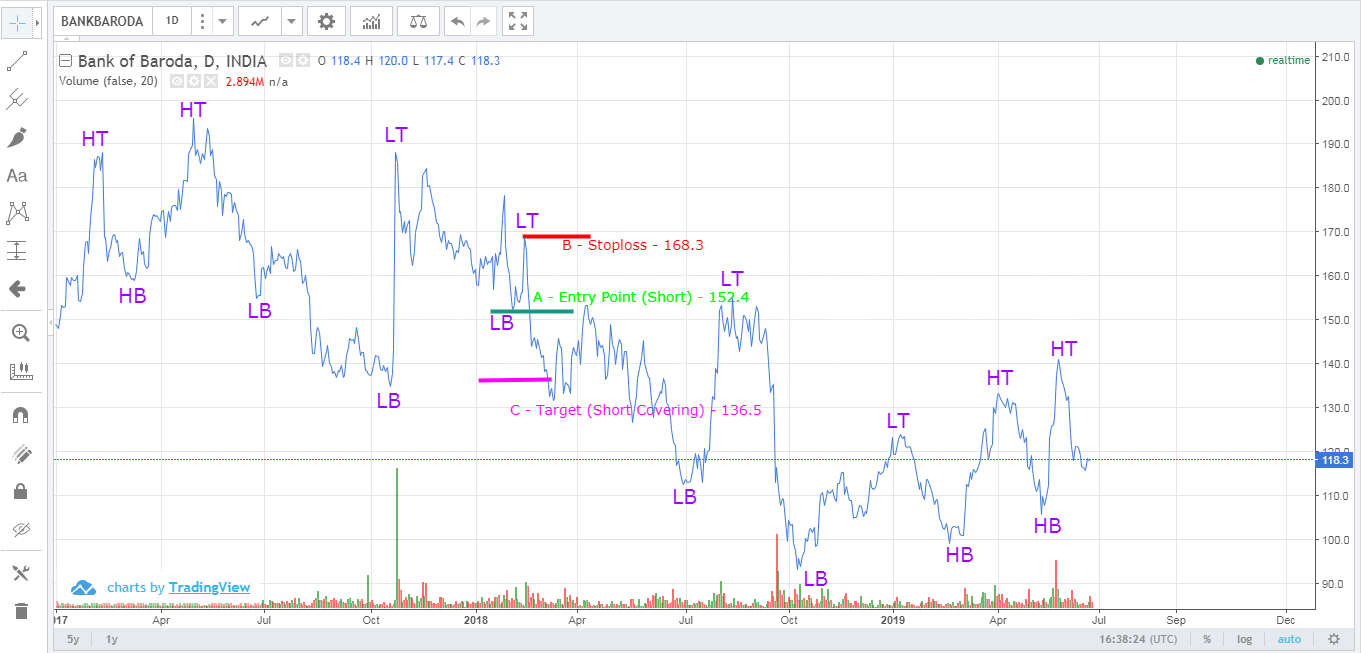
Allen wrote a new post, BANKBARODA – DOW – BEARISH TREND 4 years, 10 months ago
After Identifying the LT to LB sequence, the entry point was marked as Point A (152.4), Point B is marked as Stoploss, which is high of Lower Top (B= 168.3). The target is point C (136.5) which coveres the Risk
-
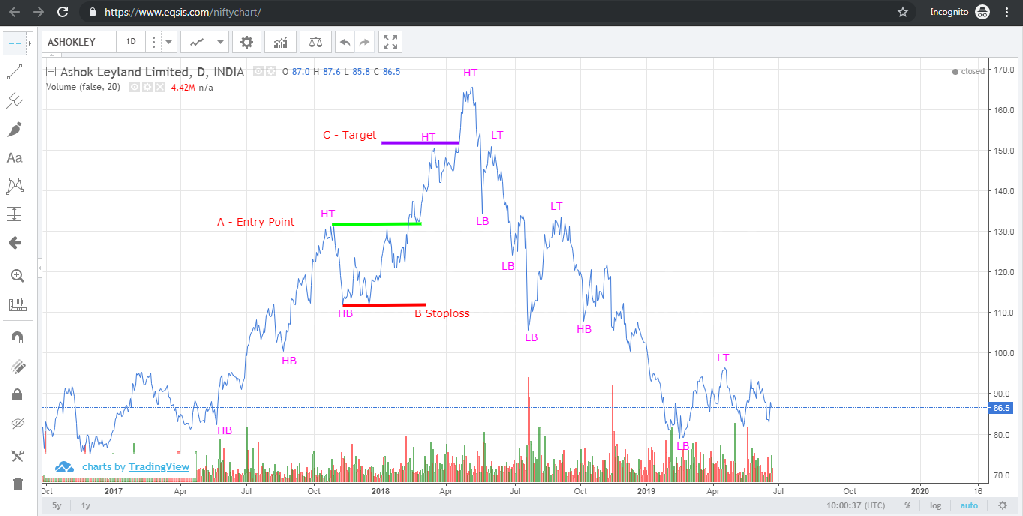
Allen wrote a new post, ASHOKLEYLAND – DOW THEORY – BULLISH TREND 4 years, 10 months ago
To define a bullish trend, the HB to HT sequence is Identified. The entry point is A (132.0) and Stop loss is B (111.9) , the Target is Point C (152.1) . We take long position at Point A and Long unwinding at P
-
Allen commented on the post, Dow theory 4 years, 10 months ago
Hi Nikilan,
Cool post. Appreciate working out the exercises.
Please refer the below answer for the last two questions
When to buy and sell using Dow Theory? For how long the trend will be reliable?: BUY :
-
Allen wrote a new post, ACC Limited – DOW THEORY – BULLISH TREND 4 years, 10 months ago
Following the HB to HT sequence Make an Entry at 1495.3 taking a Long Position and Mark stoploss at 1385.8 which is the low of the bottom. Then Long Unwinding position (Target) is set at 1604.8. There was a huge
-
Allen and
Ayshwariya are now friends 4 years, 10 months ago
-

Aswin.R and
Allen are now friends 4 years, 10 months ago
-
Allen and
Bala Manikandan M are now friends 4 years, 10 months ago
-
Allen wrote a new post, INTRADAY – EVERY MINUTE, FUTURE BECOMES THE PAST 4 years, 10 months ago
Intraday Analysis is analyzing a stock to trade with in the same day. A top down approach is used while analyzing the stocks.
The trade has to be completed with in the same trading day otherwise a penalty will
-
Allen commented on the post, YARDSTICKS IN CANDLESTICKS 4 years, 10 months ago
Yes Naresh, These exercises are very good.
-
Allen wrote a new post, INDICATORS – THEREFORE 4 years, 10 months ago
Technical Indicators are ready to consume reports of price movement calculated using Algorithms.
They can be Trending Indicators and Non trending Indicators. They assist in taking a decision, not the main
-
Allen commented on the post, DOW! – BOW! – WOW! 4 years, 10 months ago
Thank you Sir.
- Load More