
@hensildon
-
Hensildon wrote a new post, Flag Pattern witnessed 2 years, 5 months ago
Flag pattern identified with volume low during sideways movement and increase in volume for buying
The trade: Long position after breakout
Entry : Rs.2846
Stoploss : Rs.2774
Target : Rs. 2932 (1:1 ratio)
0
-
Hensildon wrote a new post, HEAD AND SHOULDER WITNESSED AT NIFTY 50 DURING 01 JAN 2020 2 years, 5 months ago
Head and shoulder pattern identified with volume low at right shoulder
The trade: Short position
Entry : Rs. 11992
Stoploss : Rs.12229 (neckline)
Target : Rs. 11775 (1:1 ratio)
0
-
Hensildon wrote a new post, DOUBLE TOP witnessed at SUN TV NETWORK durin jan 24 2020 2 years, 5 months ago
Equivalent top identified with volume at point B is high
The trade: Short position
Entry : Rs. 460 (with volume support)
Stoploss : Rs. 503 (The recent LT)
Target : Rs. 418 (1:1 ratio)
-
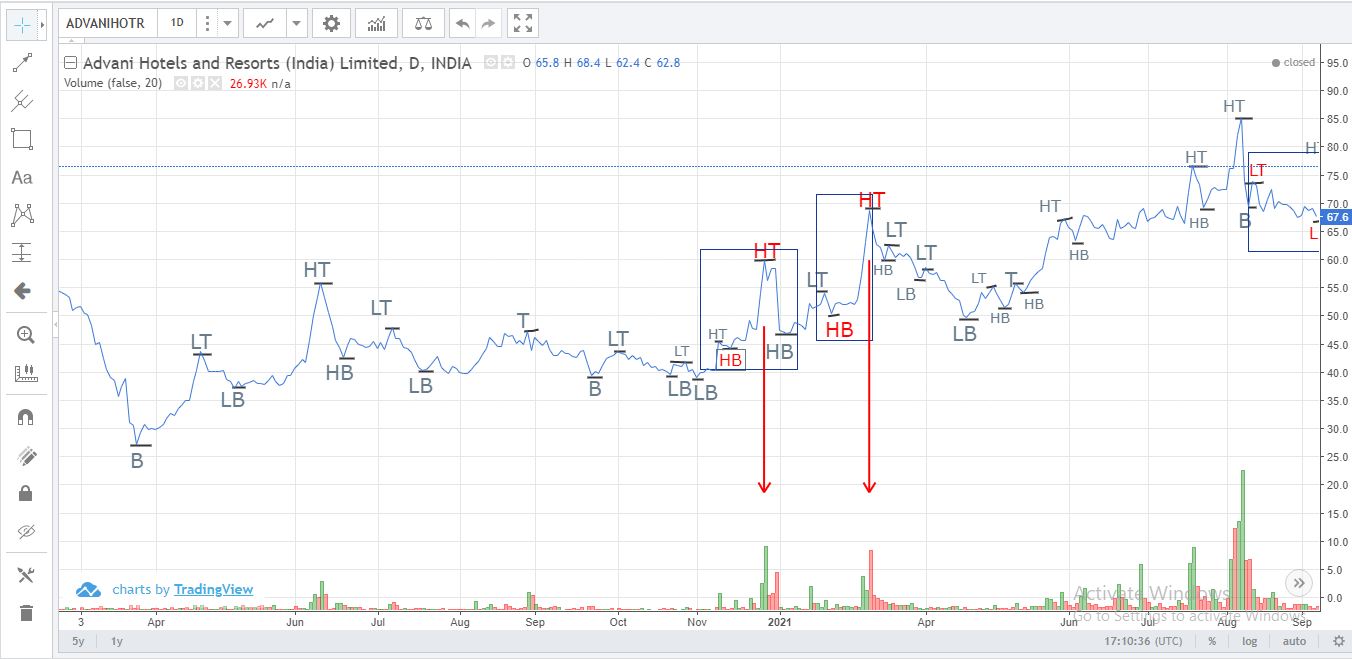
Hensildon wrote a new post, Higher bottom – Higher top witnessed during 2020 nov and 2021 May 2 years, 5 months ago
The daily chart of Advani hotels and resort with 2 year trading data with volume information has been chosen for the Dow theory analysis.
As the first step, the major tops were identified and marked. Then each
-
Hensildon wrote a new post, Revision of INTRADAY ANALYSIS 2 years, 5 months ago
Intraday is about trading(bought & sold) in the same day to make income/profit. Intraday analysis is based on market sentiment, i.e, Market direction, Sector contribution and selecting the stock trading with high
-
Hensildon wrote a new post, Revision of INDICATORS 2 years, 5 months ago
Indicators are tools with the predefined analysis and set of algorithms, this can be applied on the trend to get the indication of price movement. It can be used as supporting tool to confirm the analysis derived
-
Hensildon wrote a new post, Revision of GAP ANALYSIS 2 years, 5 months ago
On a technical analysis chart, a gap represents an area where no trading takes place means a market gap is the difference between the closing price of one period and the opening price of the next period. Market
-
Hensildon wrote a new post, Revision of CANDLESTICKS ANALYSIS 2 years, 5 months ago
candlesticks is Japanese way of identifying demand and supply. when compared to any other charts candlesticks provide us more information. accounts few days to study and provides a short term trend ie weekly
-
Hensildon wrote a new post, Revision of Basic Stock Market Analysis 2 years, 5 months ago
Stock analysis is about expecting or predicting the price movement of a stock by using proper logic.
Fundamental Analysis and Technical Analysis are the logics used.
fundamental analysis is about studying a -
Hensildon wrote a new post, Revision of Basic of Stock trading 2 years, 5 months ago
Trading done through Exchange where buyers and sellers meet and trade for the price they want. SEBI who are responsible for preventing any risk from counter party. Trader can quote any amount of shares and lot in
-
Hensildon wrote a new post, Recalling Basics Of Stock Trading 2 years, 5 months ago
Stock Market is all about investing and trading a companies shares to increase its capital amount to give an extensively output products.so the company comes to public through advertising for entering into stock
-

EQSIS and
Hensildon are now friends 2 years, 6 months ago
-
Hensildon became a registered member 2 years, 6 months ago