
@donson
-
Donson wrote a new post, Rsi indicates bullish momentum on vedanta 4 years, 6 months ago
Bullish pattern is formed1- rsi touches demand zonre2-starts to move towards supply zone3- coformation of doji with high volume is formed
-
Donson wrote a new post, Exhaustion gap-Nbcc during 2017 4 years, 6 months ago
Exhaustion gap is formed in nbccall conditions are satisfied;1-close at its days low2-trnding zone upwards3-volume is high
-
Gunasekaran Ramasamy and
Donson are now friends 4 years, 6 months ago
-
Donson wrote a new post, Breakout Gap-HDFC bank during 2017 feb 4 years, 6 months ago
A clear breakout gap is formedAll conditions are satisfied;1-Breakout during trading range2- High volume during breakout3-Gap not filled in near terms
-
Donson wrote a new post, Area Gap-Adaniports 4 years, 6 months ago
A clear area gap is formed in sideway market.All conditions are satisfied;1-Appears in trading range2-Gaps filled in near terms3-Volume is low during gap day
-
Donson wrote a new post, bullish hammer candle- canara bank 4 years, 6 months ago
A clear bullish trend reversal hammer candle pattern is formed..all conditions are satisfied;1- a significant fall in price2- High volume3- Hammer in green colourLong entry-243Stop loss-224Target-264 hence target is achieved
-
Donson commented on the post, Triangle pattern formed at Adaniports during 2018 may 4 years, 6 months ago
point D will be the Stop Loss Right…
-
Donson wrote a new post, Bullish trend reversal Doji candle- Nifty 4 years, 6 months ago
A clear bullish doji candle is formedAll conditions are satisfied;1- significant fall in price is pause2- high volumelong entry-9971Stop loss-9685Target-9875hence target is achieved
-
Donson wrote a new post, Bullish piercing candle-indusinbk during 2018 nov 4 years, 6 months ago
A bullish piercing pattern is formed..all conditions are satisfied;1-body covered previous day low2- Today body covered above 50%3-upper tail small in size Long entry-1436Stoploss-1330Target-1540hence target is achieved
-
Donson wrote a new post, Engulfing candle- Dabur during june 20 4 years, 6 months ago
A clear Englufing candlestick pattern is formed at DaburAll conditions are satisfied;1- A fall in price2-A previous body is fully covered by bullish body3- A slight Increase in trade volumeLong
-
Donson wrote a new post, Triangle pattern formed at Adaniports during 2018 may 4 years, 6 months ago
A clear triangle pattern is witnessed at adaniports during 2018 mayall conditions are satisfied;1-min 1.5 months2- 5 wave corrective pattern3- breakout with high volume short entry-358stoploss-386Target-330Hence
-
Donson wrote a new post, Flag pattern-TataMotors during April 2019 4 years, 6 months ago
A clear flag pattern is formed in Tata motors during april 2019Conditions for flag pattern is satisfied;1-A steeper pole is formed2- Accumulation is formed upto 5 days3- Breakout made with high
-
Donson wrote a new post, Head and shoulder pattern at NTPC during July 2017 TO may 2018 4 years, 6 months ago
A clear head and shoulder pattern is formed at NTPC..Conditions Satisfied head and shoulder’1-left shoulder with high volume2- right shoulder low volume3-Duration min 3months 4- left shoulder,Head,Right shoulder is formed..
-
Donson wrote a new post, Double bottom is formed at Justdial During 2018 march to may 4 years, 6 months ago
A clear double bottom is formed in Justdial during 2018 march to may..All conditions are satisfied;1- Min 20 days duration2-Breakout with high volume3- Two equivalent bottoms are formed..Long entry-above
-
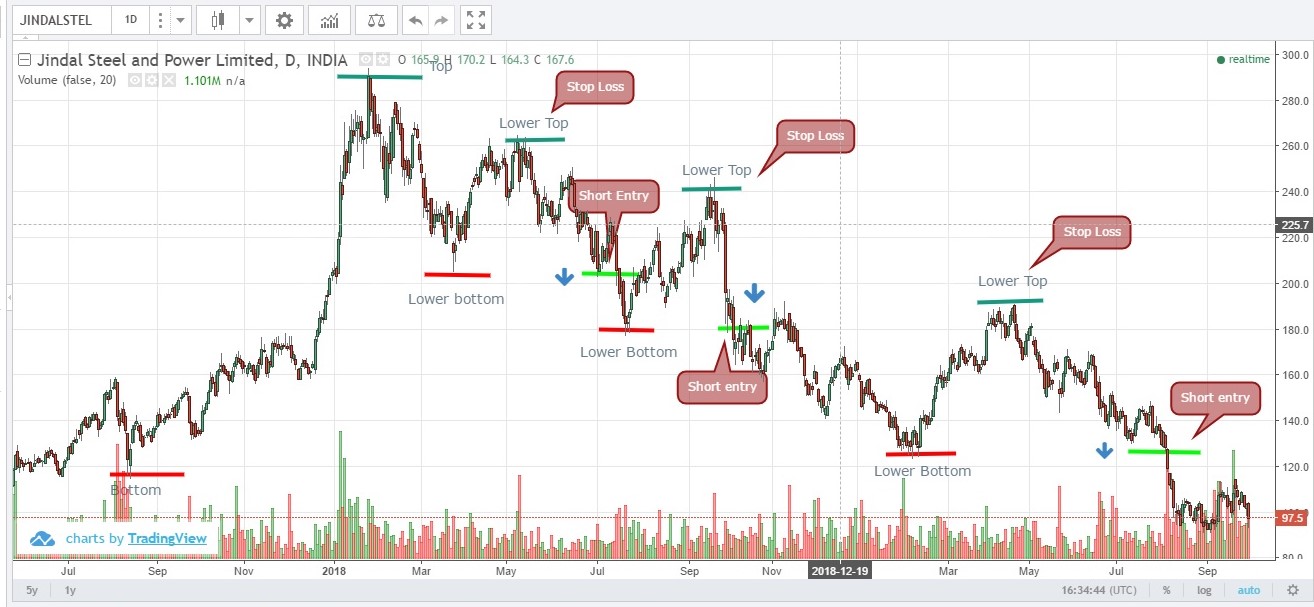
Donson wrote a new post, Dow theory Bearish trend at Jindalstel-Between 2017 to 2019 4 years, 6 months ago
Lower top and lower bottom is formed in jindastel..3 higher top and 3 lower bottoms are formed..1- Created a short position during 2018 july below 203.52- Created a short position during 2018 oct below 180.23-
-
Donson wrote a new post, Day 10 Activity – Intraday analysis 4 years, 7 months ago
Intraday means buying and selling of shares in a same day…For intraday many broker gives a additional leverage…. First we need to check the FII activity and then global market performance…Then we have to see
-
Donson wrote a new post, Day 9 Activity- Technical indicators.. 4 years, 7 months ago
Indicators generally overlay on price chart data to indicate where the price is going, or whether the price is in an “overbought” condition or an “oversold” condition…based on past closing price technical
-
Donson wrote a new post, Day 8 Activity- Gap alaysis 4 years, 7 months ago
today open price is higher then the yesterday closing price is called gap.important announcement regarding a company after market time makes gap to appear..This type of overnight announcement is risk one for
-
Donson wrote a new post, Day 7 Activity – candle stick analysis 4 years, 7 months ago
candle sticks will help to identify the trend reversal for short term..Candle sticks is formed because of buying and selling..candlestick analysis used to forecast the market using day chart weekly chart and
-
Donson wrote a new post, Day 6 Activity- Price patterns 4 years, 7 months ago
price pattern is formed during accumulation and distribution…there are many types like Cup pattern,Flag pattern,Triangle pattern,Head and Shoulder Pattern..A high volumes should be need for this patterns while breakout..
- Load More