

Tata Steel on the verge of a breakout; chart suggests more upside
- The stock has closed around the neckline of double bottom formation, backed by strong volumes on 29th Oct 2019.
- The stock has been continuously moving in a “lower top- lower bottom” bearish price cycle formation for nearly 2 years.
- The major support for the stock is around 52-week low of 320 level.
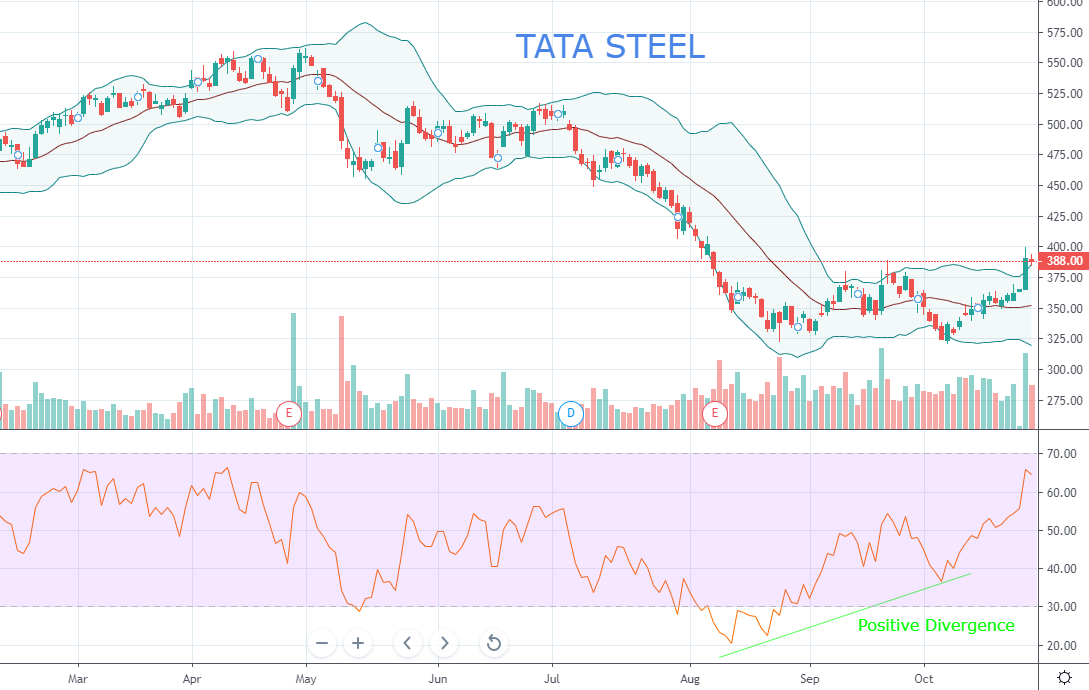
- On the indicator front, the stock have closed above the higher range of Bollinger band. Above all, On daily time-frame charts, the RSI shows a positive divergence against the price.
- The recent developments in the stock and no immediate resistance levels are suggesting strong positive momentum in coming days.