
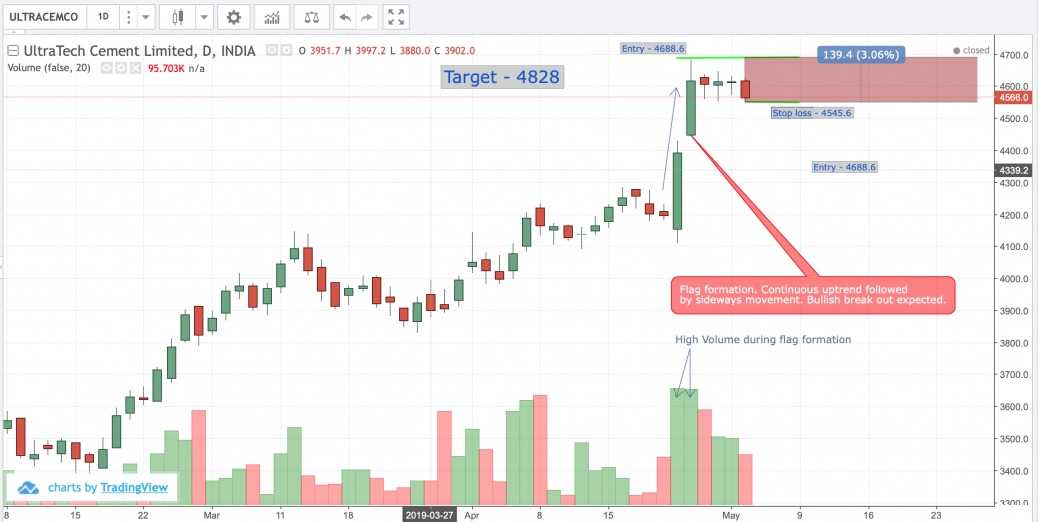
The price recently had broken the previous resistance level . Flag formation can be seen. Continuous uptrend followed by sideways movement. Bullish break out expected with high volume.
feel free to call us +919500077790 info@eqsis.com
The price recently had broken the previous resistance level . Flag formation can be seen. Continuous uptrend followed by sideways movement. Bullish break out expected with high volume.
| M | T | W | T | F | S | S |
|---|---|---|---|---|---|---|
| 1 | 2 | 3 | 4 | 5 | 6 | 7 |
| 8 | 9 | 10 | 11 | 12 | 13 | 14 |
| 15 | 16 | 17 | 18 | 19 | 20 | 21 |
| 22 | 23 | 24 | 25 | 26 | 27 | 28 |
| 29 | 30 | |||||
 Bearish-GAP-SHORT-BICON-25-10-2019 October 25, 2019
 FEDERAL BANK – BEARISH ENGULFING October 17, 2019
 Cummins India – Bearish Engulfing – 24Sep19 September 25, 2019
 Day29-Tata Motors DVR – Bearish Piercing – 12Sep19 September 12, 2019
 Day27-Bearish-Engulfing pattern-Tech Mahindtra-09Sep19 September 10, 2019
Stock Trading is business, the success depends not just on capital or subscribing advisory services or participating workshops. The factors such as your awareness level about business, Efforts and your contributions, Smartness, Knowledge in analysis and trading instrument, availability of infrastructure and emotional control determine your success.
EQSIS, A Stock Market Research Firm
Knowledge is Power. Here you may start from basics, get support while practicing and evolve as active analyst, later you can become a pro


good work
HI HARI,
It is better to wait till the flag gets breakout and then decide the entry point. Because during the horizontal movement the chances of triggering the stop loss is high and we are not sure whether it will breakout positively.
This is what i felt but i may be wrong, experts please guide us.
good
Today It looks like rectangular sideways movement now. Consolidation is taking place. Volume expected High during Breakout.
RSI OF ULTRATECH