
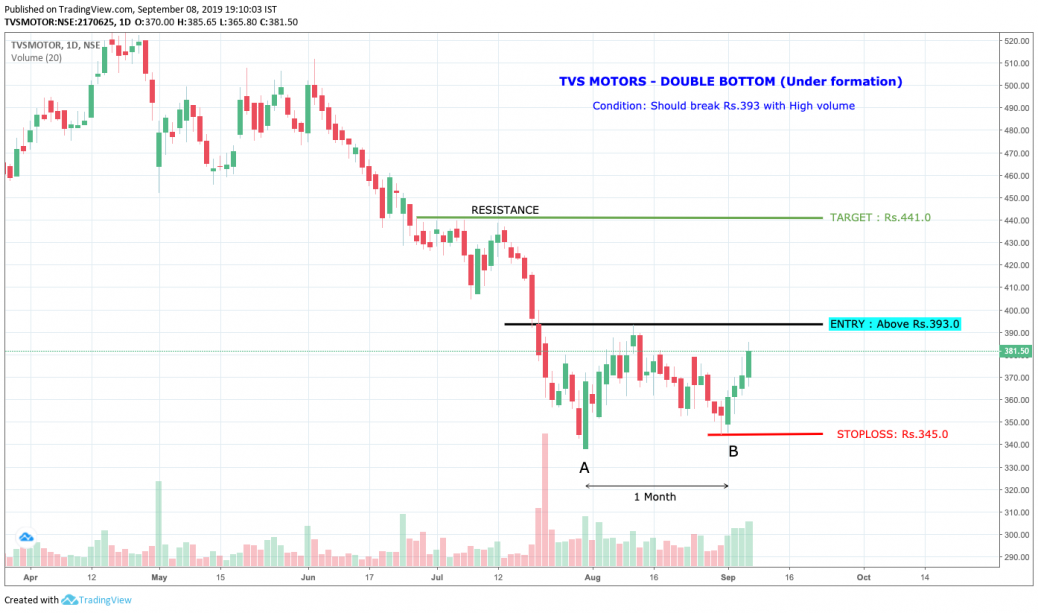
In the chart of TVS Motors, two identical bottoms are noticed after a significant bearish movement.
The gap between two bottoms is 1 month.
After testing the 2nd bottom, the stock price is moving towards the neck zone which is around Rs.393.
The strong resitance zone is noticed around the price of Rs.441.
The current price is above the 21 days Moving average.
The RSI is around 54, which indicates still there is a scope for buying. Also the significant volume increase is notived continuously after the second bottom.
The LONG position may be initiated only if the price is breaking above 393 with High volume.
—————————————————————————————–
Stock Ticker – NSE: TVSMOTOR – TVS Motor Company Ltd. – AUTOMOBILE
Bullish Trade plan:
Entry Level 393.0 Target 441.0 Stoploss 345.0
Analyst Rating – :3/5
View Posted on 2019-09-08


Update on 11-Sep-2019:
The Price broke Rs.393 levels with High volume, which has qualified the double bottom.
The Target achieved in TVS motors.