
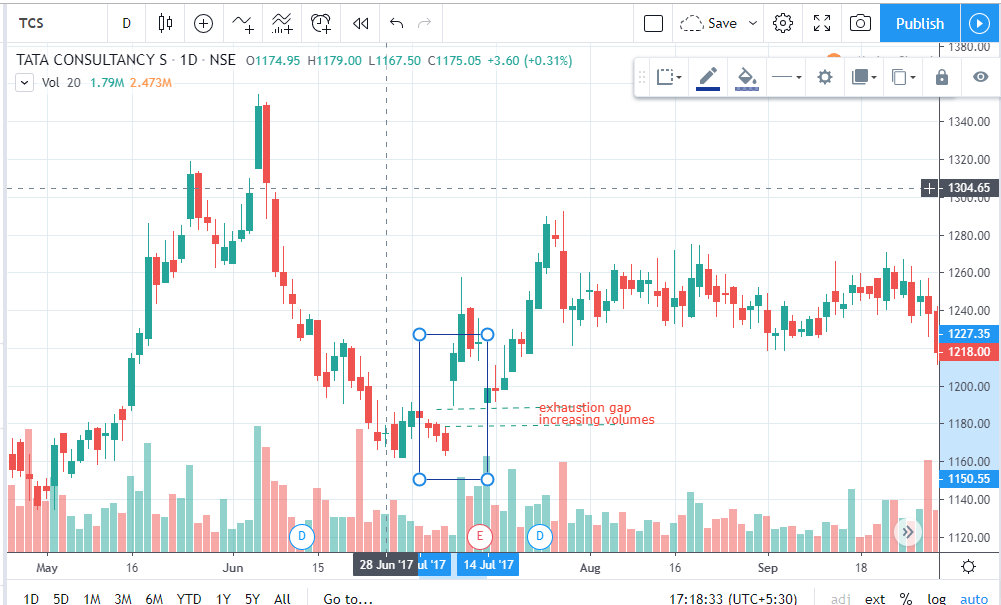
Exhaustion gap observed after a bullish trend. Green candlestick with increasing volumes indicate trend reversal.
feel free to call us +919500077790 info@eqsis.com
Exhaustion gap observed after a bullish trend. Green candlestick with increasing volumes indicate trend reversal.
| M | T | W | T | F | S | S |
|---|---|---|---|---|---|---|
| 1 | 2 | 3 | 4 | 5 | 6 | 7 |
| 8 | 9 | 10 | 11 | 12 | 13 | 14 |
| 15 | 16 | 17 | 18 | 19 | 20 | 21 |
| 22 | 23 | 24 | 25 | 26 | 27 | 28 |
| 29 | 30 | |||||
 Bearish-GAP-SHORT-BICON-25-10-2019 October 25, 2019
 FEDERAL BANK – BEARISH ENGULFING October 17, 2019
 Cummins India – Bearish Engulfing – 24Sep19 September 25, 2019
 Day29-Tata Motors DVR – Bearish Piercing – 12Sep19 September 12, 2019
 Day27-Bearish-Engulfing pattern-Tech Mahindtra-09Sep19 September 10, 2019
Stock Trading is business, the success depends not just on capital or subscribing advisory services or participating workshops. The factors such as your awareness level about business, Efforts and your contributions, Smartness, Knowledge in analysis and trading instrument, availability of infrastructure and emotional control determine your success.
EQSIS, A Stock Market Research Firm
Knowledge is Power. Here you may start from basics, get support while practicing and evolve as active analyst, later you can become a pro


Dear Manoj,
It is a good spot but I doubt some points are missing.
Please review the conditions for exhausting gap again.
1) The gap appear after a trending zone seems to be a runaway gap, but, if it gets filled on the same day then it can be considered to be an exhaustion gap.
2) The close should be at its day’s low during the runaway gap.
3) The volume should be very high during the day to terminate the existing trend.
The exhaustion gap is difficult to spot because of the gap the filled. But it can be identified with the color of the candle.
Nice explanation sir
thanks for pointing out sir
Exhaustion gap occurs at the top or bottom with huge volume, chances are more that the market is exhausted and the existing trend is at pause. It is important to note that the exhaustion pattern should not be treated as a significant reversal.