
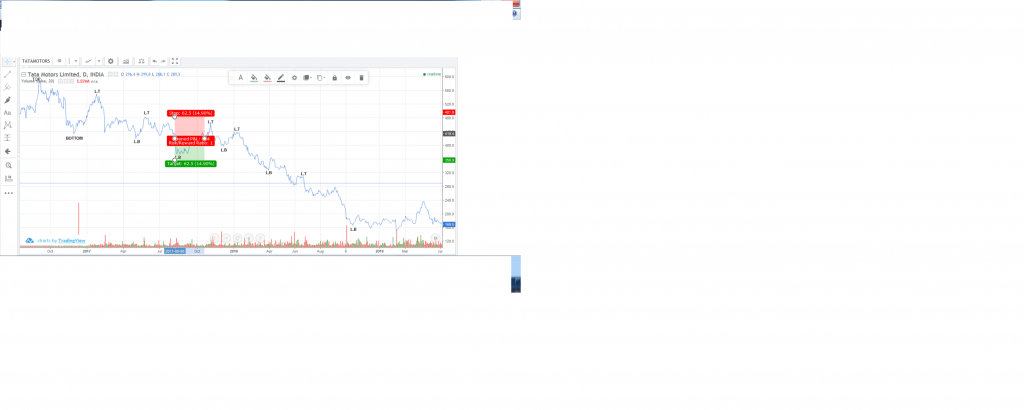
The daily chart of Tata Motors with 2 year trading data with volume information has been chosen for the Dow theory analysis.
As the first step, the major tops were identified and marked. Then each top / bottom were qualified as Lower Top (LT), Lower Bottom (LB), Higher Top (HT) and Higher bottom (HB) with reference to their previous Top /Bottom.
The sequence of Lower Top (LT) and Lower Bottom (LB) indicates the trend is Bearish and the similar trend was identified in the selected chart. Also it is supported by High volumes.
The trade: Short
Entry : Rs. 419.4 (with volume support)
Stoploss : Rs.481.9 (The recent LT)
Target : Rs.356.9 (1:1 ratio)