
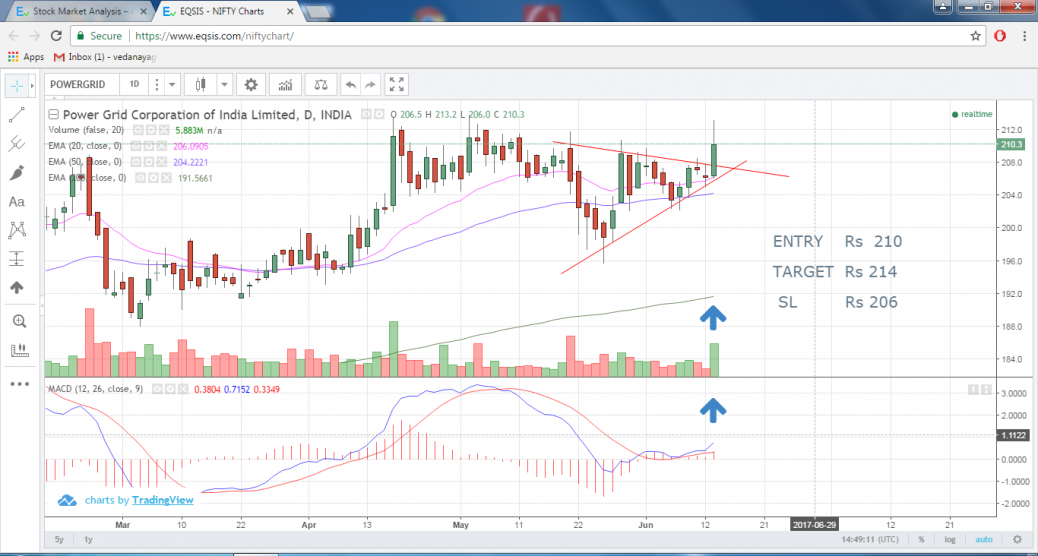
The sym triangle breakout happened with above 20 day avg volume and Delivery volume 66.3% A s the range surpassed the immediate resistance of Rs 212 the target is fixed at 52 w high ie Rs 214
feel free to call us +919500077790 info@eqsis.com
The sym triangle breakout happened with above 20 day avg volume and Delivery volume 66.3% A s the range surpassed the immediate resistance of Rs 212 the target is fixed at 52 w high ie Rs 214
| M | T | W | T | F | S | S |
|---|---|---|---|---|---|---|
| 1 | 2 | 3 | 4 | 5 | 6 | 7 |
| 8 | 9 | 10 | 11 | 12 | 13 | 14 |
| 15 | 16 | 17 | 18 | 19 | 20 | 21 |
| 22 | 23 | 24 | 25 | 26 | 27 | 28 |
| 29 | 30 | |||||
 Bearish-GAP-SHORT-BICON-25-10-2019 October 25, 2019
 FEDERAL BANK – BEARISH ENGULFING October 17, 2019
 Cummins India – Bearish Engulfing – 24Sep19 September 25, 2019
 Day29-Tata Motors DVR – Bearish Piercing – 12Sep19 September 12, 2019
 Day27-Bearish-Engulfing pattern-Tech Mahindtra-09Sep19 September 10, 2019
Stock Trading is business, the success depends not just on capital or subscribing advisory services or participating workshops. The factors such as your awareness level about business, Efforts and your contributions, Smartness, Knowledge in analysis and trading instrument, availability of infrastructure and emotional control determine your success.
EQSIS, A Stock Market Research Firm
Knowledge is Power. Here you may start from basics, get support while practicing and evolve as active analyst, later you can become a pro


Good Observation sir
volume , Triangle every thing is fine . but the stock is trailing near to it resistance zone of 210-214. if the stock breaks the zone buying can be considered.
Triangle pattern is mend for slight higher gains. Target can be kept higher so that the stop loss and target can be maintained
thank you for your amazing work sir
Dear sir
thank you for your feed back