-
Saritha and
 Tamil Selvam J are now friends 4 years, 8 months ago
 -
Saritha wrote a new post, Area gap With volume-PNB 4 years, 8 months ago
The Area gap or the temporary gap is identified and it occured at short span of time in sideways.Usually, the price moves back or goes up in order to fill the gaps in the coming days. If the gap is filled, they
-
Saritha wrote a new post, Area Gap Without Volume- IDBI Bank 4 years, 8 months ago
This is Area gap without volume, here it got filled in near term.
-
Saritha and
Bala Manikandan M are now friends 4 years, 8 months ago
-
Saritha commented on the post, Evening star -Siemens 4 years, 8 months ago
Hi ,
Thanks for helping me with better example -
varatharajan and
Saritha are now friends 4 years, 8 months ago
-
Saritha commented on the post, Evening Star-ICICI 4 years, 8 months ago
Hi Naresh,
Thanks for correcting me.I uploaded the same pattern again .kindly correct me if any thing wrong. -
Saritha wrote a new post, Evening star -Siemens 4 years, 8 months ago
Evening star is identified in Siemens during 2nd may 2018.The stop loss is kept at upper shadow of doji and the entry is given at 1110 and the target is selected at 1058.
-
Saritha wrote a new post, APOLLO-Bearish piercing 4 years, 8 months ago
Bearish piercing is found in Apollo during 6th sep 2016.Here the red body cover the green body more than a half with good volume.
-
Saritha wrote a new post, HAVELLS-Bullish piercing 4 years, 8 months ago
Bullish piercing is identified in Havells during 30th june 2017.Entry -465.0Exit -48.9Stop loss -442
-
Saritha wrote a new post, Evening Star-ICICI 4 years, 8 months ago
After a significant rise in price the Doji(evening star)is appered on 31st Aug 2018 and very next day there was a significant fall in price.so we can go for a short position.
-
Saritha wrote a new post, Morning star-Ambujacem 4 years, 8 months ago
After a significant price fall the morning star is identified with good volume.The trader can give their entry at the end of the doji’s upper wick and stop loss can be at the end of the lower wick .And the
-
Saritha wrote a new post, ABB india ltd-Bearish piercing pattern 4 years, 8 months ago
The bearish piercing pattern is identified in ABB india ltd.Here the bearish candle covers half of the body of previous bullish candle.Entry-1228Exit-1165Stop loss-1294
-
Saritha wrote a new post, Bullish Piercing- TCS 4 years, 8 months ago
Bullish piercing pattern is identified in TCS 1st feb 2017.Here the green candle cover half of the previous red candle hence we confirm thats a bullish piercing pattern.Entry-2243.2Target -2342.7stop loss- 2156.7.
-
Saritha commented on the post, Head and Shoulder -IBULHGFIN 4 years, 8 months ago
Hi Venkatesh,
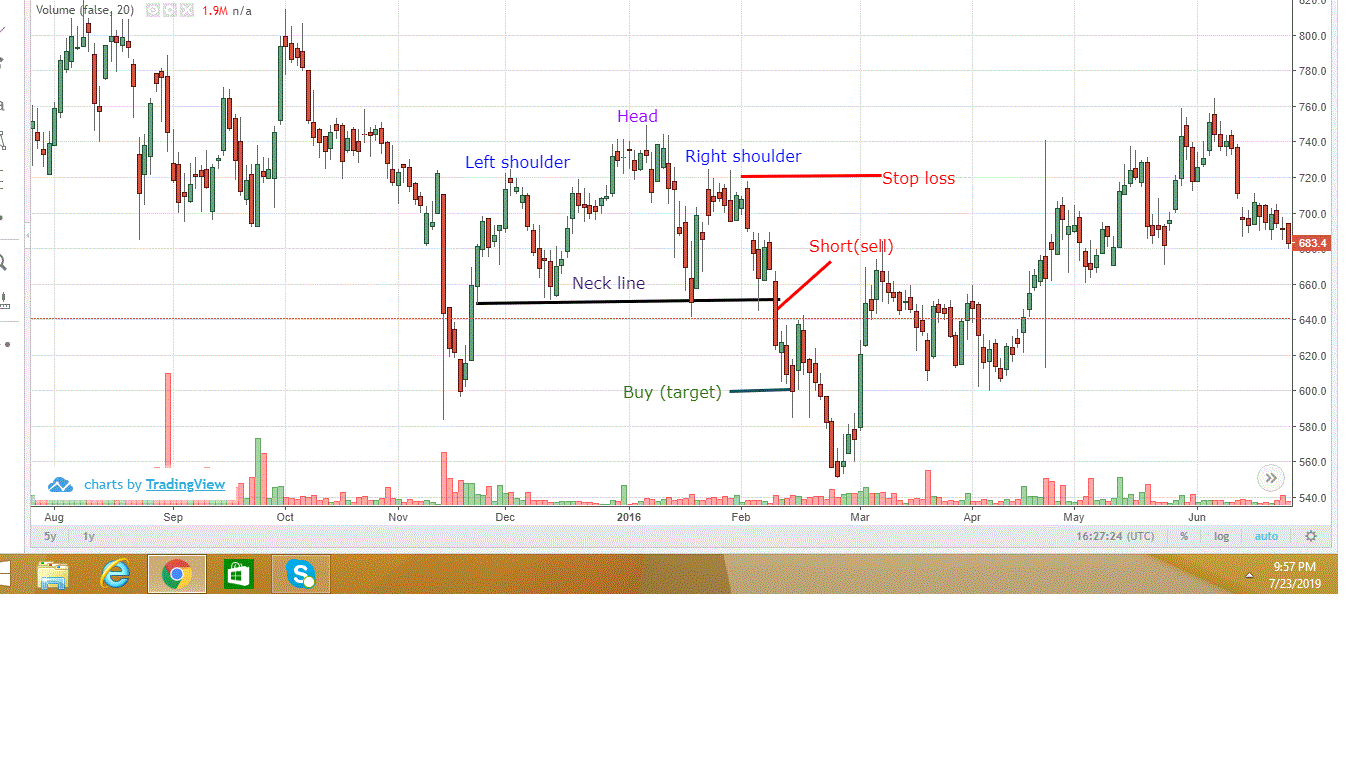
In my trade plan i had set stop loss at shoulder level because, we could confirm that the left shoulder is our previous resistance when the trail bounce back again at(right shoulder) the same -
Saritha commented on the post, Adani ports-Flag pattern 4 years, 9 months ago
Hi naresh,
Thanks for correcting me by giving clear explanation.i should have seen EQSIS youtube video before going into that pattern.Anyway i tried again to identify the correct pattern of both Flag (in TCS) -
Saritha wrote a new post, Head and Shoulder -IBULHGFIN 4 years, 9 months ago
The head and shoulder pattern is witnessed in India bull housing during 23 nov 2015.The entry point can fix after it breaks the neck line and the stop loss is at the shoulder level.

-
Saritha wrote a new post, TCS -Bullish flag pattern 4 years, 9 months ago
The bullish flag pattern is witnessed at TCS during 2nd march 2016 .Entry- 2382.5Target – 2474.5Stop loss – 2312.5
-
Saritha wrote a new post, Bullish and Bearish Engulfing pattern in HDFC 4 years, 9 months ago
The Bullish Engulfing Candlestick Pattern is a bullish reversal pattern, usually occuring at the bottom of a downtrend.The second candle completely “engulfs”the real body of the first one.Bullish engulfing:Entry –
-
Saritha wrote a new post, ABB India ltd -Triangle Brearish 4 years, 9 months ago
Its an descending triangle pattern which is witnessed at ABB during 9 may 2017 .This triangle pattern offers traders a bearish signal,indicatind that price will continue lower as the pattern completes itTraders
- Load More
