
@kavitharamachandran
-
Kavitha R wrote a new post, BEARISH FLAG – PCJEWELLER 4 years, 10 months ago
Rectangular sideways movement after a steeper down pole is seen thus forming a flag.After the flag negative breakout is seen thus it is considered to be bearish flag.Volume during the breakout is high.Time taken
-
Kavitha R wrote a new post, HANGING MAN – TATACHEM 4 years, 10 months ago
Hanging man with very long upper tail and very small lower tail is formed after a strong bullish trend.Volume that the day of hanging man formation is very high, thus indicates strong resistance zone.Short
-
Kavitha R wrote a new post, AREA GAP WITH VOLUME – SBIN 4 years, 10 months ago
Gap occurred in the trading zone.Shows sideways movement. The volume traded during the gap is high.
-
Kavitha R wrote a new post, BULLISH PIERCING- MCDOWELL – N 4 years, 10 months ago
Previous trend seems to be bearish.Today’s green body covers the previous day’s low.The green body managed to cover more than 50% of the previous day’s body. The upper tail is low.
-
Kavitha R wrote a new post, BREAKOUT GAP UNFILLED- IDEA 4 years, 10 months ago
Breakout gap noticed after a sideways price movement.The gap is formed in Non- Trending zone and it is not filled in near future.Since the gap is not filled, it shows the bears are strong.Short position can be considered.
-
Kavitha R wrote a new post, AREA GAP – GAIL 4 years, 10 months ago
Gap appeared in the trading range, hence it is a area gap.The gap is filled in near terms.The volume traded during the gap day is not so high, that is less than the average.
-
Kavitha R wrote a new post, ADANIPORTS BULLISH ENGULFING 4 years, 10 months ago
The recent fall in price is witnessed.The latest bullish body covered the previous day’s bearish body.A slight increase in the traded volume is witnessed.In spite of continuous fall in the price, a green body
-
Kavitha R wrote a new post, ADANIPORTS BEARISH ENGULFING 4 years, 10 months ago
The recent raise in price is witnessed.The latest bearish body covered the previous day’s bullish body.A slight increase in the traded volume is witnessed.In spite of continuous increase increase in the price, a
-
Kavitha R wrote a new post, BHARTIARTL – TRIANGLE PATTERN – BULLISH 4 years, 10 months ago
5 Wave corrective pattern formed a triangle shaped structure.Triangle breakout is around 70% zone.Volume traded is above average in the breakout zone.Long position can be considered after the positive breakout zone.
-
Kavitha R wrote a new post, FLAG PATTERN – ITC 4 years, 10 months ago
A steeper pole is seen. Rectangular shaped sideways movement is formed after the steeper pole. Thus a FLAG is formed.Positive pole flag gave a positive breakout.Volume is also increased during the breakout
-
Kavitha R wrote a new post, DOUBLE TOP- CIPLA 4 years, 11 months ago
Two equivalent tops are found.Volume traded at both point B( Top 2) and point C(point below previous low) is above average.Duration between two top are around 6 months.Short position can be created below
-
Kavitha R wrote a new post, DOUBLE BOTTOM- TATAMOTORS 4 years, 11 months ago
Two equivalent bottom are seen.volume traded is high both in point B( 2nd bottom) and point C(level equal to previous top).Duration between the two bottom is more than six months.Long position can be considered
-
Kavitha R wrote a new post, TATAPOWER – BEARISH 4 years, 11 months ago
Chart shows a bearish trend.There was a significant volume traded.Short position can be created at the price of 74.2.Target price 71.5.Stop loss 76.9
-
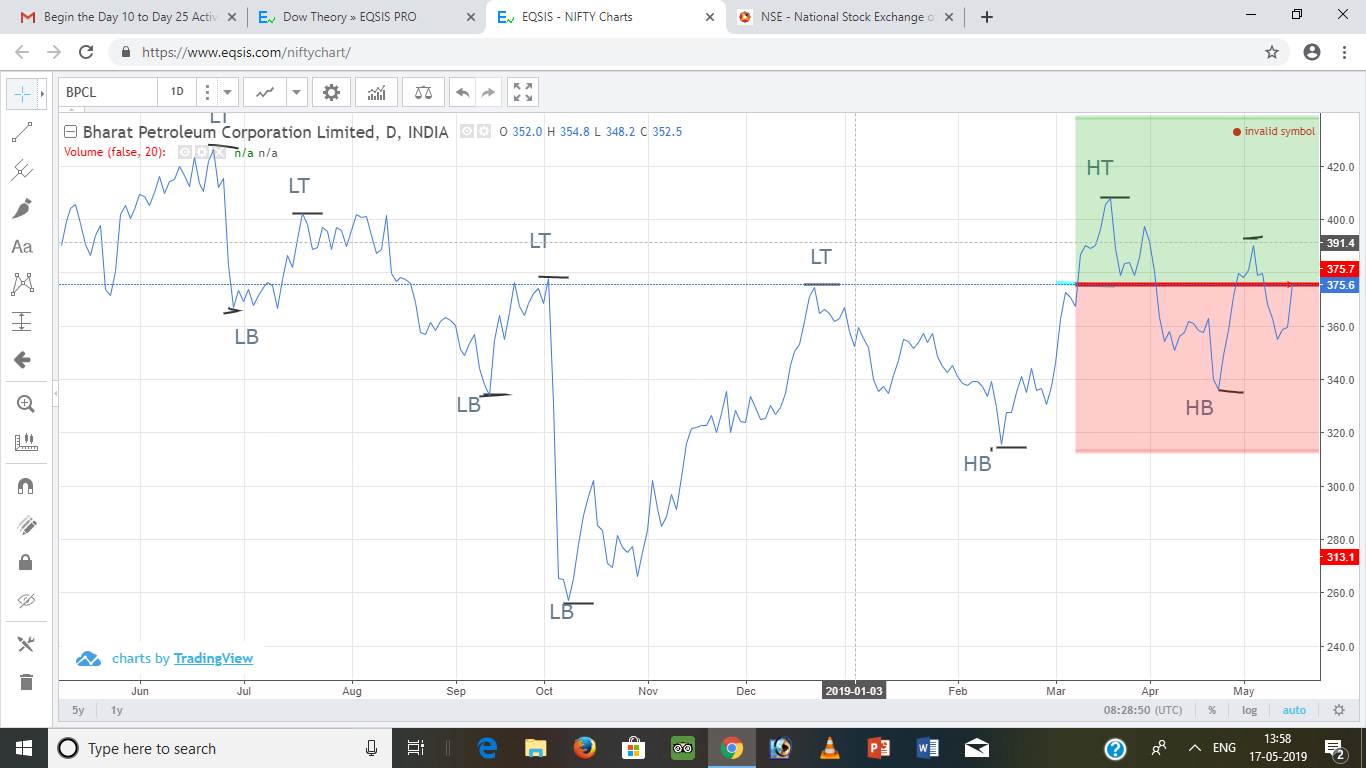
Kavitha R wrote a new post, BPCL-BULLISH LONG POSITION 4 years, 11 months ago
The chart shows a progressive raise after a significant fall.Volume traded is also high.Long position can be considered after the price hit 376.Target price is 438.Stoploss is 313.
-
Kavitha R wrote a new post, INTRADAY TRADING ANALYSIS 4 years, 11 months ago
Day trading is speculation in securities, specifically buying and selling financial instruments within the same trading day, such that all positions are closed before the market closes for the trading day. Traders
-
Kavitha R wrote a new post, TECHNICAL INDICATORS 4 years, 11 months ago
Technical Indicators are often squiggly lines found above, below and on-top-of the price information on a technical chart. Indicators that use the same scale as price are typically plotted on top of the price bars
-
Kavitha R wrote a new post, GAP ANALYSIS 4 years, 11 months ago
Gaps occur unexpectedly, which is why no trading occurs between the two price bars. From one day to the next the perceived value of the asset among investors has changed. Because they are unexpected, gaps can be
-
Kavitha R wrote a new post, CANDLESTICK PATTERNS 4 years, 11 months ago
Candlestick shows the opening price, closing price, highest trading price and lowest trading price of the stock on that particular day. Based on these 4 prices, candle sticks can form various patterns like
-
Kavitha R wrote a new post, PRICE PATTERNS 4 years, 11 months ago
Price pattern is a pattern within a chart when price are graphed. In stock and commodity markets trading, chart pattern studies play a large role during technical analysis. When data is plotted there is usually a
-
Kavitha R wrote a new post, DOW THEORY. 4 years, 11 months ago
Dow theory is a theory which says the market is in upward trend if one of its averages (industrial or transportation) advances above a previous important high and is accompanied or followed by a similar advance in
- Load More