
@gowthamg
-
GowthamG wrote a new post, Indusind bank Hanging man 4 years, 2 months ago
Searched for a bullish trend
Identified a Hanging man like patter in the end
Checked the colour and found it to be red
Checked the volume and found it to be increasing
Confirmed it to be a hanging man
Entry
-
GowthamG wrote a new post, Indusind Bank Hammer 4 years, 2 months ago
Searched for a bearish pattern
Identified a hammer like pattern
Checked the colour and found it to be green
Checked the volume, found it to be high
Confirmed that it is a hammer
Entry 1664
Target 1696
Stop loss 1632
-
GowthamG wrote a new post, ULTRA TECH MORNING STAR 4 years, 2 months ago
Searched for bullish trend
found a doji with high volume
entry 4500
stop loss 4600
target 4700
-
GowthamG wrote a new post, ULTRATECH CEMENT EVENING STAR 4 years, 2 months ago
Searched for a bearish trend
identified a doji before trend reversal with high volume
entry 386
stop loss 276
target 496
-
GowthamG commented on the post, GODREJ BEARISH ENGULFING 4 years, 2 months ago
@naresh, sir please check this analysis and tell whether such a decision can be made.
Thank you. -
GowthamG wrote a new post, HCL BULLISH ENGULFING 4 years, 2 months ago
Identified a bearish pattern
Identified an engulfing before trend reversal
checked the volume and found it to be high
entry 1046
stop loss 1011
target 1081
-
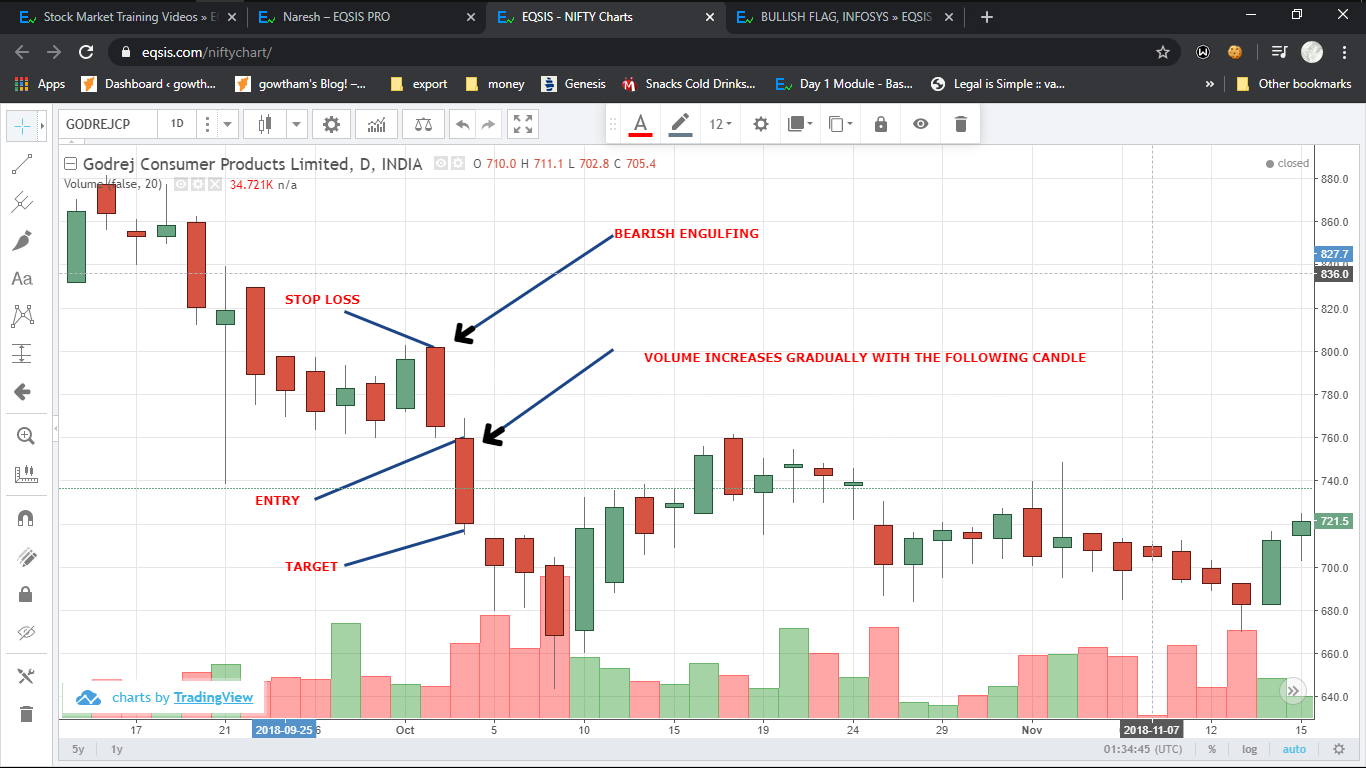
GowthamG wrote a new post, GODREJ BEARISH ENGULFING 4 years, 2 months ago
identified a bullish pattern
identified a an engulfing pattern before trend reversal
checked the volume, found it to be not high during engulfing, but increased with the following candle.
entry 759
stop loss
-
GowthamG posted a new activity comment 4 years, 2 months ago
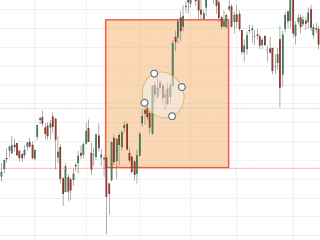
And about the flag part,inside the circle, it seems to drift down a little bit, is it a factor which disqualifies it from being a flag (assuming that it had a correct pole)
-
GowthamG wrote a new post, INFOSYS BULLISH TRIANGLE 4 years, 2 months ago
Identified a triangle like pattern
Checked for A,B,C,D and E peaks
Checked the break through – found an increase in volume, breakthorugh at 75% of the triangle area
entry 721
stop loss 664
target 778
-
GowthamG wrote a new post, ONGC BEARISH TRAINGLE 4 years, 2 months ago
Found a triangle like pattern
checked for A, B, C, D and E peaks
identified a break out with high volume at near 75% of triangle area
entry 140
Target 127
stop loss 153
-
GowthamG commented on the post, TCS, BEARISH FLAG 4 years, 2 months ago
Yes sir, I have changed it. Thank you for mentioning.
-
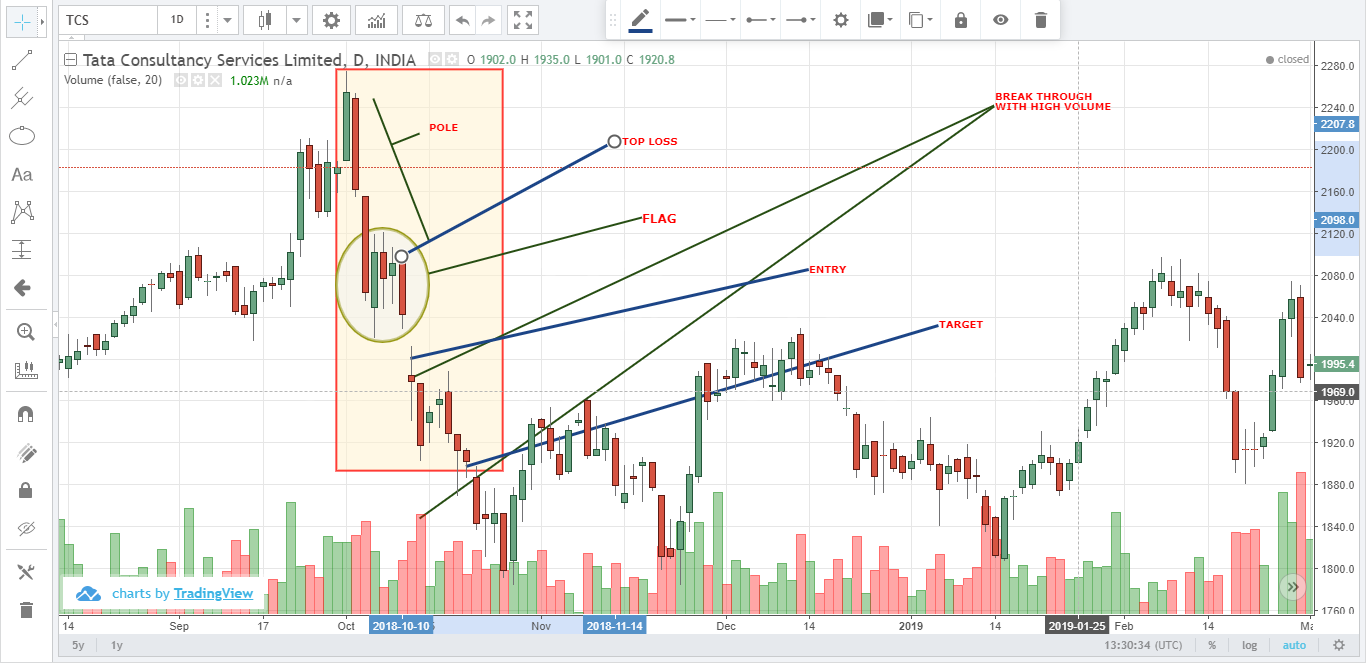
GowthamG wrote a new post, TCS, BEARISH FLAG 4 years, 2 months ago
Looked for bearish trend
Identified a bearish flag- duration 6 days
Found the volume to increase during break through
entry at 1999
stop loss 2098
target 1900
-
GowthamG wrote a new post, BULLISH FLAG, INFOSYS 4 years, 2 months ago
Identified a bullish trend
Identified a flag like pattern
Checked for flag duration to be 4-7 days – found it to be 4 days
made sure the flag was not drifting downwards
checked volume during the break through-
-
GowthamG posted a new activity comment 4 years, 2 months ago
and also, is the pole steep enough or should it be steeper
-
GowthamG posted an update 4 years, 2 months ago
@naresh should this be considered as a lower drift in the pattern not a flag or can it be considered as a flag
-
GowthamG wrote a new post, NIPPON PAINTS CUP PATTERN 4 years, 3 months ago
Identified a cup like pattern
Checked for low volume at the bottom- found it
Tool a long position while the up got filled
entry at 164
stop loss 354
target 259
-
GowthamG wrote a new post, HEAD AND SHOULDER ONGC 4 years, 3 months ago
Saw a head and shoulder like pattern
Checked whether the volume keeps decreasing from left to right
Found the same – Accumulation and distribution
Trend reversal from bullish ti bearish
Created a short
-
GowthamG commented on the post, DOUBLE TOP AXIS BANK 4 years, 3 months ago
Thank you sir. I’ll try once again.
-
GowthamG wrote a new post, DOUBLE TOP AXIS BANK 4 years, 3 months ago
Identified two peaks
Checked the time period between them
Checked the volume at the peaks and at the point where the new low surpasses the previous low
Found all the conditions for a double top to be
-
GowthamG commented on the post, DOUBLE BOTTOM IN MRF TYRES 4 years, 3 months ago
With entry, target and stop loss mentioned
- Load More
 Screenshot (108)
and also, is the pole steep enough or should it be steeper
Hi,
The flag formation usually takes place when the stock posts a sustained rally with almost a steep increase in stock prices at least 2-3 days so, don’t consider a single day steeper pole.
And about the flag part,inside the circle, it seems to drift down a little bit, is it a factor which disqualifies it from being a flag (assuming that it had a correct pole)
If prices drift below the flag pattern, then the pattern is no longer valid better you should avoid it