
@anirudhs
-
Anirudh S. wrote a new post, UPL Limited Double Bottom 4 years, 11 months ago
-
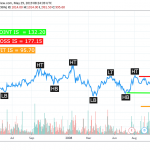
Anirudh S. wrote a new post, Titan Company — Double Top Bullish 4 years, 11 months ago
-
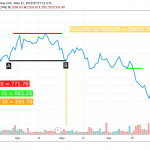
Anirudh S. wrote a new post, UPL Limited — Dow Bearish 4 years, 11 months ago
-
Anirudh S. wrote a new post, Wipro LTD — Bullish Pattern 4 years, 11 months ago
-
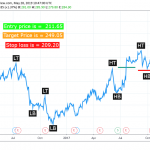
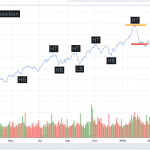
Anirudh S. wrote a new post, Nifty — Dow Theory Bullish Pattern 4 years, 11 months ago
Nifty Trend is Higher Long Position Entry Price = 7896.0Stop Loss = 10461.4Target Price = 11130.0
-
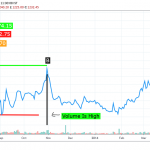
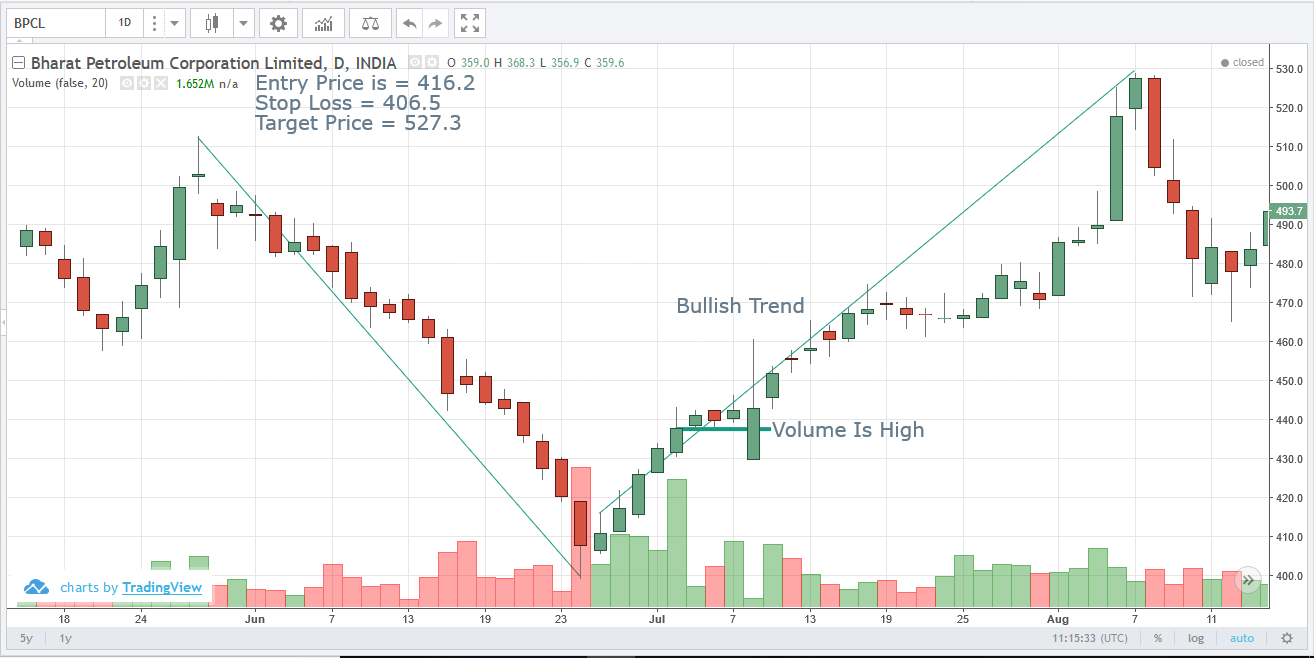
Anirudh S. wrote a new post, Dow Theory — BPCL Bullish Pattern 4 years, 11 months ago
BPCL Shares goes to bullish and volume is high.Entry Price is = 416.2Stop Loss = 406.5Target Price = 527.3
-
Anirudh S. wrote a new post, Module Day 10 — Intraday trading 4 years, 11 months ago
Intraday is shorthand for securities that trade on the markets during regular business hours and their price movements. Day traders pay close attention to intraday price movements, timing trades in an attempt to
-
Anirudh S. wrote a new post, Module Day 9 — Technical indicators 4 years, 11 months ago
In technical analysis, a technical indicator is a mathematical calculation based on historic price, volume, or open interest information that aims to forecast financial market direction.
-
Anirudh S. wrote a new post, Module Day 8 — Gap Analysis 4 years, 11 months ago
A technique that businesses use to determine what steps need to be taken in order to move from its current state to its desired, future state. Also called need-gap analysis, needs analysis, and needs
-
Anirudh S. wrote a new post, Module Day 7 — Candlestick Analysis 4 years, 11 months ago
The opposite is true for a black bar. Candlestick charts serve as a cornerstone of technical analysis. The main usage of a candlestick patterns is to identify trends. Looking at a candlestick, one can identify an
-
Anirudh S. wrote a new post, Module Day 6 — Price Patterns 4 years, 11 months ago
A chart pattern or price pattern is a pattern within a chart when prices are graphed. In stock and commodity markets trading, chart pattern studies play a large role during technical analysis. When data is plotted
-
Anirudh S. wrote a new post, Module Day 5 — Dow Theory 4 years, 11 months ago
The key difference is that a stock market helps you trade financial instruments like bonds, mutual funds, derivatives as well as shares of companies. … The key factor is the stock exchange – the basic platform t
-
Anirudh S. wrote a new post, Module Day 4 — Basics of Stock 4 years, 11 months ago
Fundamental analysis involves analyzing a company’s financial statements to determine the fair value of the business, while technical analysis assumes that a security’s price already reflects all
-
Anirudh S. wrote a new post, Day 3 Module — Future and Option 4 years, 11 months ago
Options and futures are similar trading products that provide investors with the chance to make money and hedge current investments. An option gives the buyer the right, but not the obligation, to buy (or sell) an
-
Anirudh S. wrote a new post, Day 2 Module — Basics of Stock Market 4 years, 11 months ago
A stock market is similar to a share market. The key difference is that a stock market helps you trade financial instruments like bonds, mutual funds, derivatives as well as shares of companies. A share market
-
Saravanan Jothivengadam and
Anirudh S. are now friends 4 years, 12 months ago
-

EQSIS and
-
Anirudh S. wrote a new post, Module day 1 — Basics of Stocks. 4 years, 12 months ago
stock market is where buyers and sellers meet and sell their stocks. you can buy stocks from companies, buyers, and brokers etc…
-
Anirudh S. became a registered member 4 years, 12 months ago