
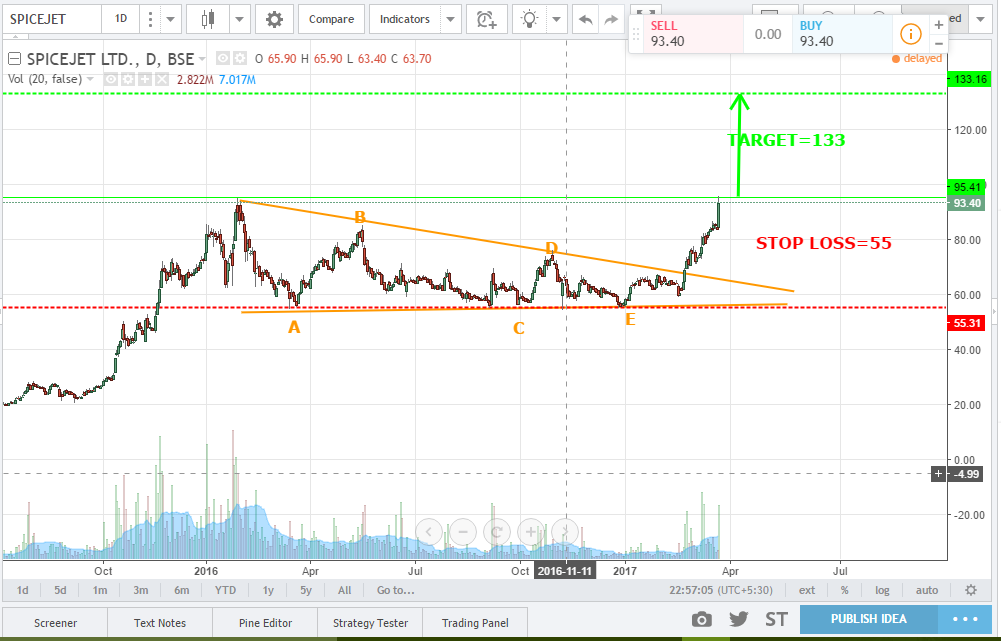
Triangle bullish chart is formed for spicejet with a high volume at breakout out of triangle.
Long positions can be taken above 95 levels for the given target and stop loss.
Also crude oil (downtrend) and regional connectivity (Udaan) are some of the good news which are happening for the airlines, so bullish pattern can be seen and a new high can be achieved in the coming months.