
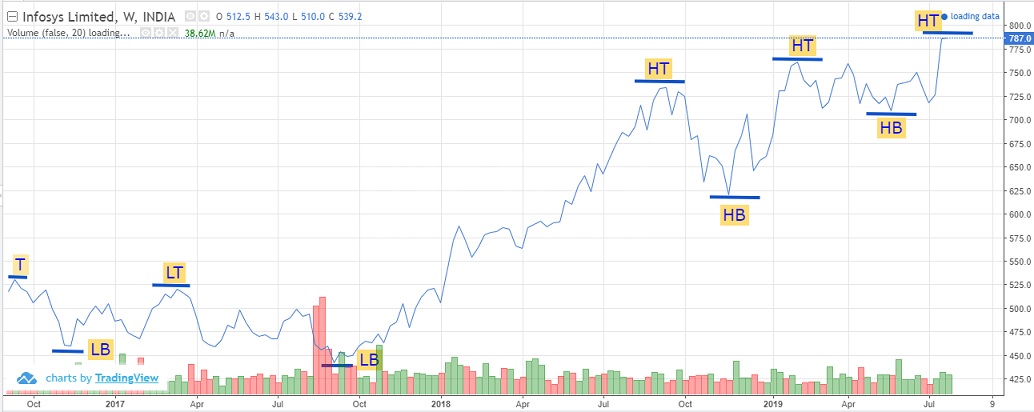
It is just my first Dow Theory analysis in which I have identified Tops and Bottoms of Infosys chart.
It is in bullish trend and it is moving higher by breaking all previous Higher Tops.
feel free to call us +919500077790 info@eqsis.com
It is just my first Dow Theory analysis in which I have identified Tops and Bottoms of Infosys chart.
It is in bullish trend and it is moving higher by breaking all previous Higher Tops.
| M | T | W | T | F | S | S |
|---|---|---|---|---|---|---|
| 1 | 2 | 3 | 4 | 5 | 6 | 7 |
| 8 | 9 | 10 | 11 | 12 | 13 | 14 |
| 15 | 16 | 17 | 18 | 19 | 20 | 21 |
| 22 | 23 | 24 | 25 | 26 | 27 | 28 |
| 29 | 30 | |||||
 Bearish-GAP-SHORT-BICON-25-10-2019 October 25, 2019
 FEDERAL BANK – BEARISH ENGULFING October 17, 2019
 Cummins India – Bearish Engulfing – 24Sep19 September 25, 2019
 Day29-Tata Motors DVR – Bearish Piercing – 12Sep19 September 12, 2019
 Day27-Bearish-Engulfing pattern-Tech Mahindtra-09Sep19 September 10, 2019
Stock Trading is business, the success depends not just on capital or subscribing advisory services or participating workshops. The factors such as your awareness level about business, Efforts and your contributions, Smartness, Knowledge in analysis and trading instrument, availability of infrastructure and emotional control determine your success.
EQSIS, A Stock Market Research Firm
Knowledge is Power. Here you may start from basics, get support while practicing and evolve as active analyst, later you can become a pro


Hi,
A double bottom is a reversal pattern that is formed after the previous downtrend. Please refer the attached screenshot
Thanks for correcting my mistake. I will find another chart with double bottom meeting the criteria.
I have changed this to a simple bullish trend analysis. I have corrected my Double bottom analysis using Ambuja cement chart as separate assignment.