
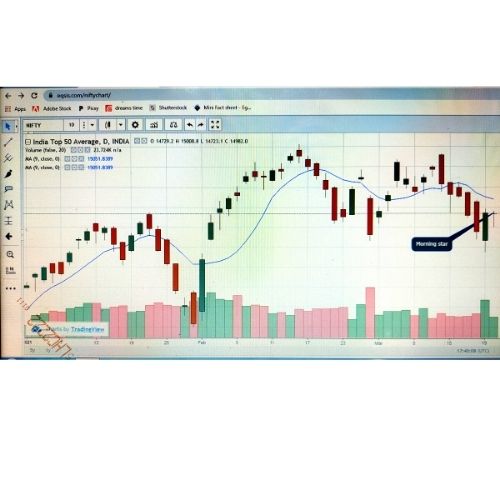
we see a morning star pattern in the above chart even though it is not able to cut the previous high and not able to sustain above previous low for short term we can see an upward move (if the Global market performs in a +ve or as we see today)
—————————————————————————————–
Stock Ticker – NSE: NIFTY – NIFTY 50 – INDEX
Bullish Trade plan:
Entry Level 14873.5 Target 15151 Stoploss 14595
Analyst Rating – :5/5
View Posted on 2021-03-22


Hi,
Conditions for the morning star formation
On the first day, a large bearish candlestick is formed, representing a further continuation of a downtrend. On the second day (DOJI DAY), a small candlestick either bullish or bearish is formed which gaps down from the first candlestick formed on Day 1( volume should be high during the Doji day). On third day a large bullish candlestick is formed which gaps up from the candlestick formed on Day2. It opens above the close of the Day 2 candlestick and closes atleast near the center or midpoint of the candlestick formed on Day 1.