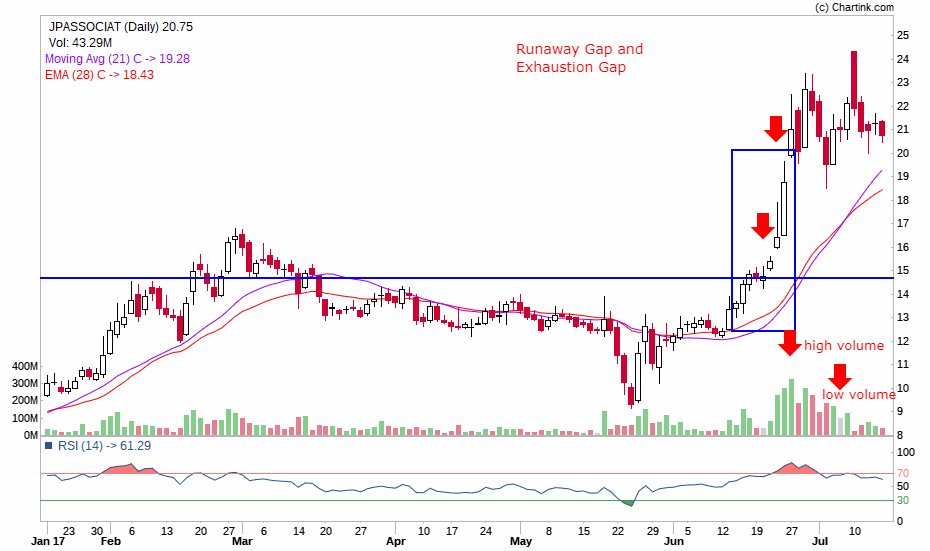
The chart shows a continuation pattern for a few months with a low volume all through, then on 1st of July we got to see a Runaway gap, with high volume. Soon we saw another gap which got filled soon and the volume stated dropping.
Jaiprakash associates shows Runaway gap and Exhaustion gap