
Relative Strength Index (RSI) is a momentum oscillator. RSI is best usable in sideways or ranging markets where the price moves between support and resistance.
RSI is a price following oscillator that ranges between 0 to 100 scale. The RSI > 70 in scale indicates a strength. The RSI < 30 indicates weakness.
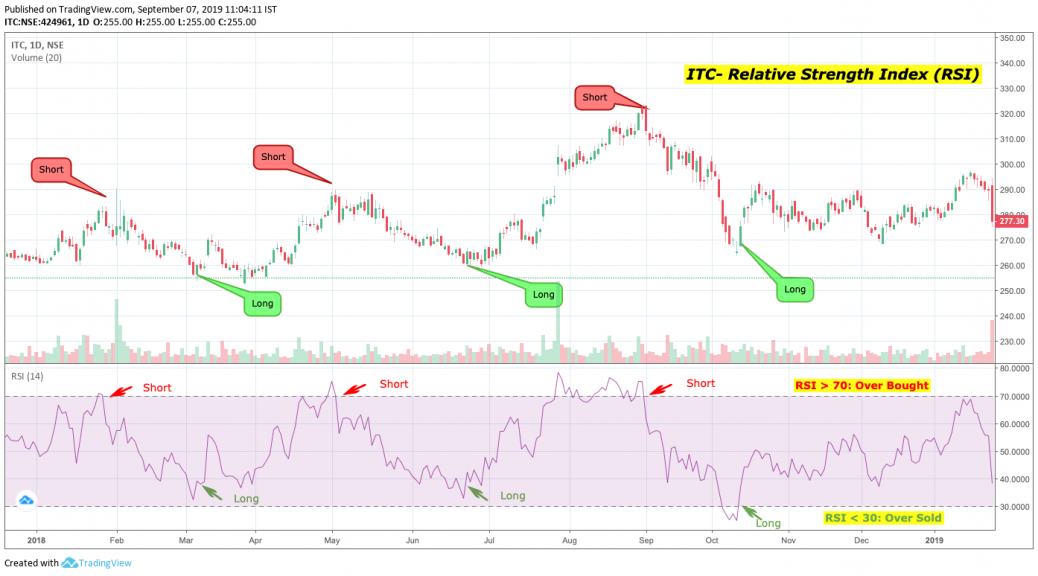
When RSI crosses down 70 scale, it is considered as the stock is overbought and SHORT positions can be initiated.
Likewise, when RSI crosses above 30 upwards, it is considered to be oversold and at this point, the LONG position can be initiated.
The above is the chart of ITC showing the RSI scale. Here in some cases, it is not crossed below 30 but reversed to upwards. This opportunity can also be used to benefit from the price movement.


Just before answered about technical Indicators. But this gives me an superb view on RSI hope i’ve missed it before answering it.
Mr.Prasad Babu,
Thanks for your comments