
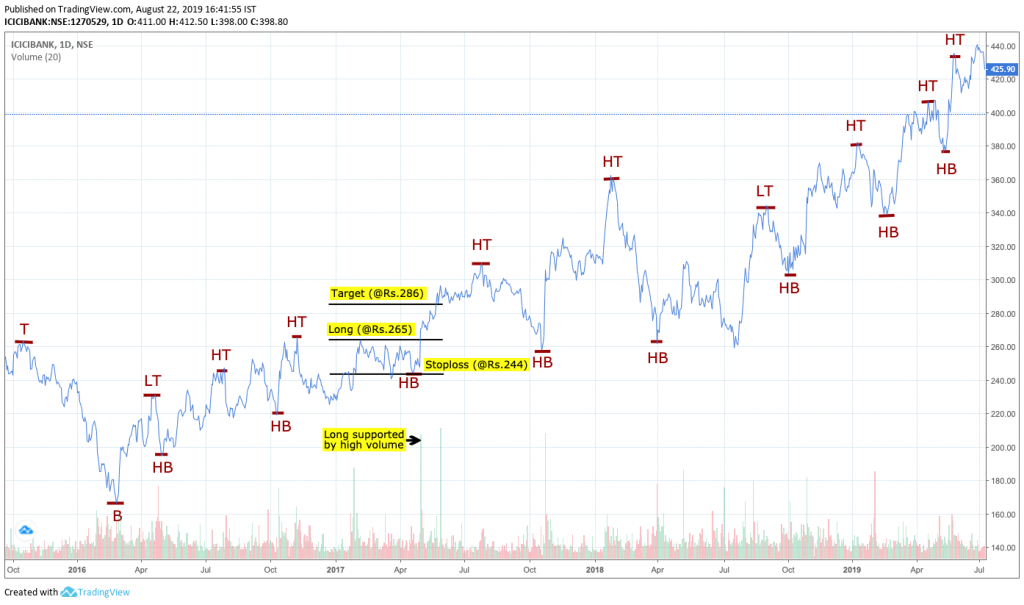
The chart of ICICI bank has been chosen with volume information for this analysis. To analyse the chart for DOW theory, daily chart of 2 years period is taken.
The major tops and bottoms were noted first. Then each top and bottoms were compared with previous tops and bottoms and thus Higher bottom (HB) and Higher tops (HT) were qualified.
The sequence of Higher bottom and higher top confirms the Bullish trend as per the Dow theory. ICICI bank’s bullish trend confirmed this.
As per dow theory, the long position can be initiated when the price breaks the previous high with high volumes.
The trade plan: Long
Entry: Rs. 265.0 (High volumes supported)
Stoploss: Rs.244 (The recent HB)
Target : Rs. 286.0 ( 1:1 ratio / Rs 21)
Trade result: The target achieved in 15 days.