
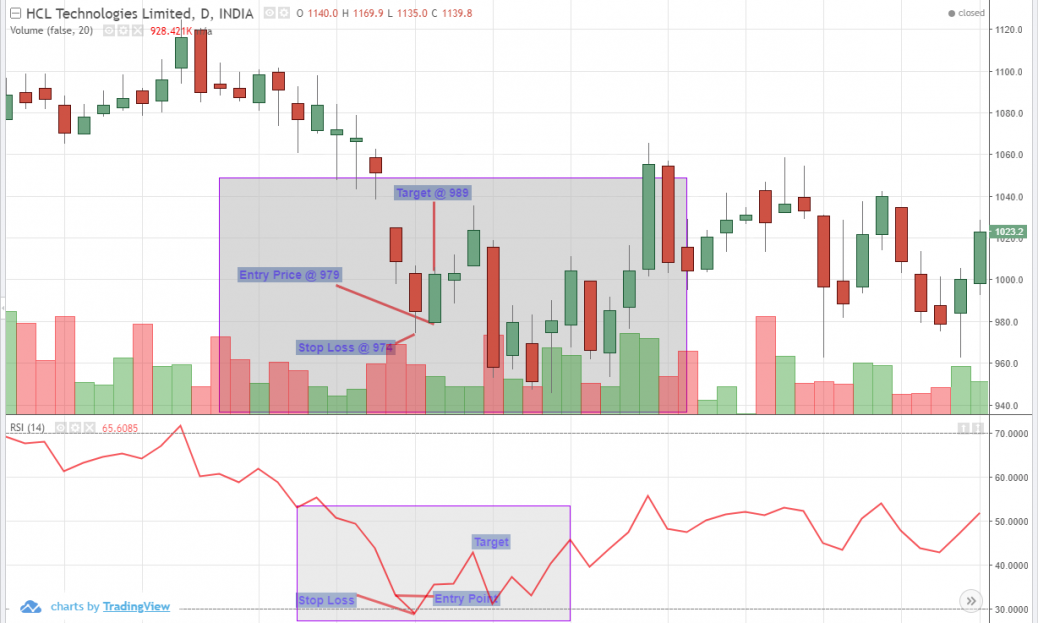
The RSI compares bullish and bearish price momentum plotted against the graph of a share’s price. Signals are considered overbought when the indicator is above 70% and oversold when the indicator is below 30%. This is a good oscillator because this can help us to determine the trend, time entries etc.
As far as HCL Tech is concerned, our entry price is shown above RSI 30 indicator so that we get extra confirmation for Buying.


HI LAKSHMINARAYANA SIR,
I think as per the RSI the entry point should be the point at which the price starts to move above the 30 mark line, which indicates over sold. And not the point where it starts to move below the 30 mark line, which indicates weakness.