
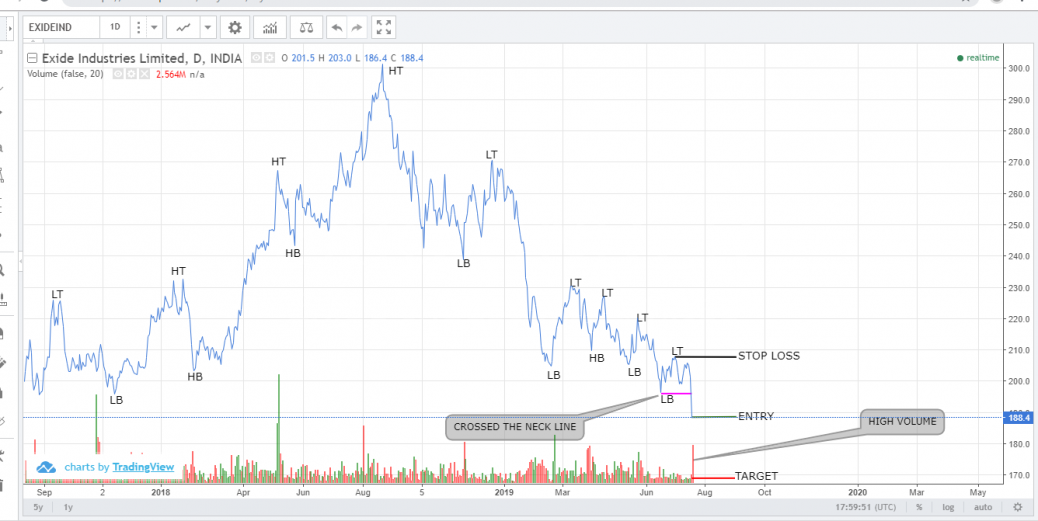
Formation of Lower top – Lower bottom sequence, with high volume while crossing the neck line is seen in Exide Industries Limited. Short position is considered.
—————————————————————————————–
Stock Ticker – NSE: EXIDEIND – Exide Industries Ltd. – AUTOMOBILE
Bearish Trade plan:
Entry Level 188.4 Target 169 Stoploss 207.8
Analyst Rating – :4/5
View Posted on 2019-07-19


Hi,
Good observation ma’am…. Thanks for posting your views
Thanks for the positive feedback sir.
Hi Triveni Karthika,
As per my analysis in this chart.
First LT was incorrectly market as it should be HT.
I Can see a Top Before the HT sequence, In this case it should be HT not LT.
Please correct me if i am wrong.
Hi, Can you please tell how do you find the target as you have mentioned the target is 169. Please explain.
Thanks in advance.
Hi Sathish, i have marked the first top as LT, since the previous major top is higher when compared to the first LT in the chart.
Okay Mam. I saw only the chart you posted.
In this how you calculating the target mam, can you please explain me ?
Add or subtract the difference between the Entry and Stop Loss from the Entry Price.
Stoploss – Entry
207.8 – 188.4 = 19.4
Entry – 19.4
188.4 – 19.4 = 169.