
The purpose of this analysis is to find a bearish trend using Dow Theory and decide the entry price, stop loss price and target price. We need at least two years of data to analyze Dow theory.
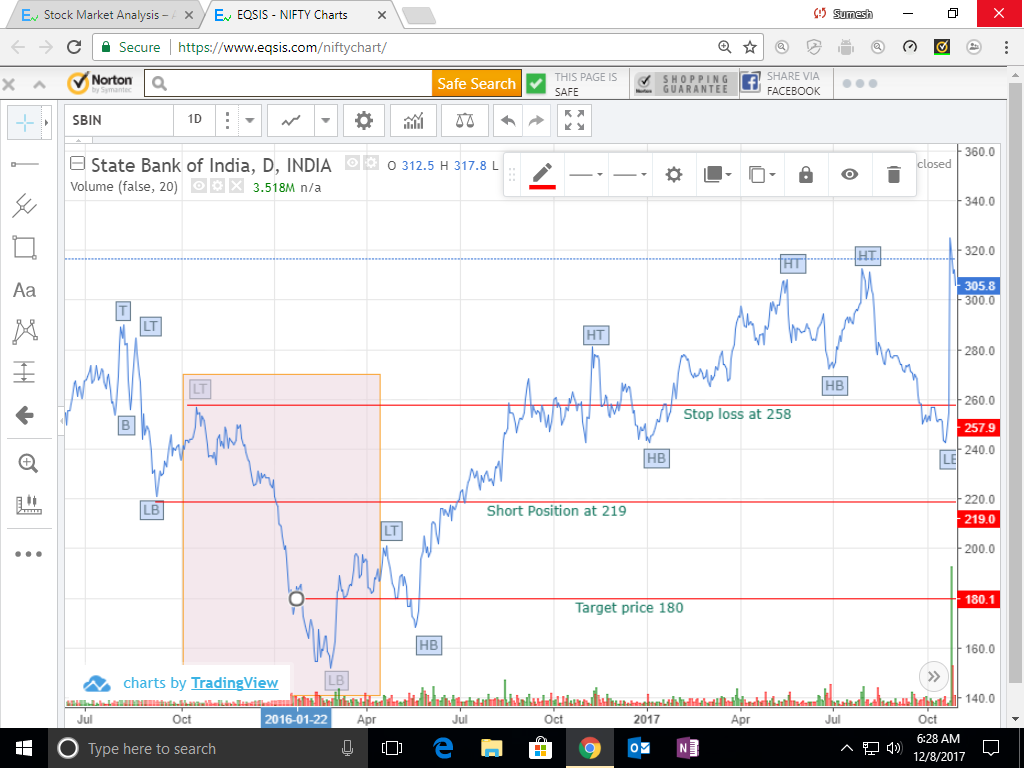
The Line chart of price movement, of State bank of India, between July 2015 and Oct 2017 is used for the analysis. All the significant tops and bottoms are marked as higher top, lower top, higher bottom and lower bottom. The movement from Lower top to lower bottom signifies the bearish trend. There should also be significant volume of trade.
Though I noticed the first bearish trend around Sep 2015, another significant bearish trend formed around October 2015 to Feb 2016, that I took for Analysis. In this trend, it has breached the previous support level (previous lower bottom) at price level 220. So, we can take a short position after it goes below 220. I have marked a short position at Rs.219. If the price rises from this level, there was a resistance (lower top) at price level 258. Hence I kept the stop loss at Rs.258. My risk here is Rs.39 (258-219). So, my reward should at least be Rs.39. So, I kept my target as Rs.180 (219 – 39).
I would have taken short position on 01-Jan-2016 and achieved target on 13-Jan-2016. I have drawn red lines to mark entry price (Short position), stop loss price and target price.


Hi sir,
Your work is very good, the explanation makes to understand the example very easily.
Many thanks for these kind words Mr.Vignesh.