
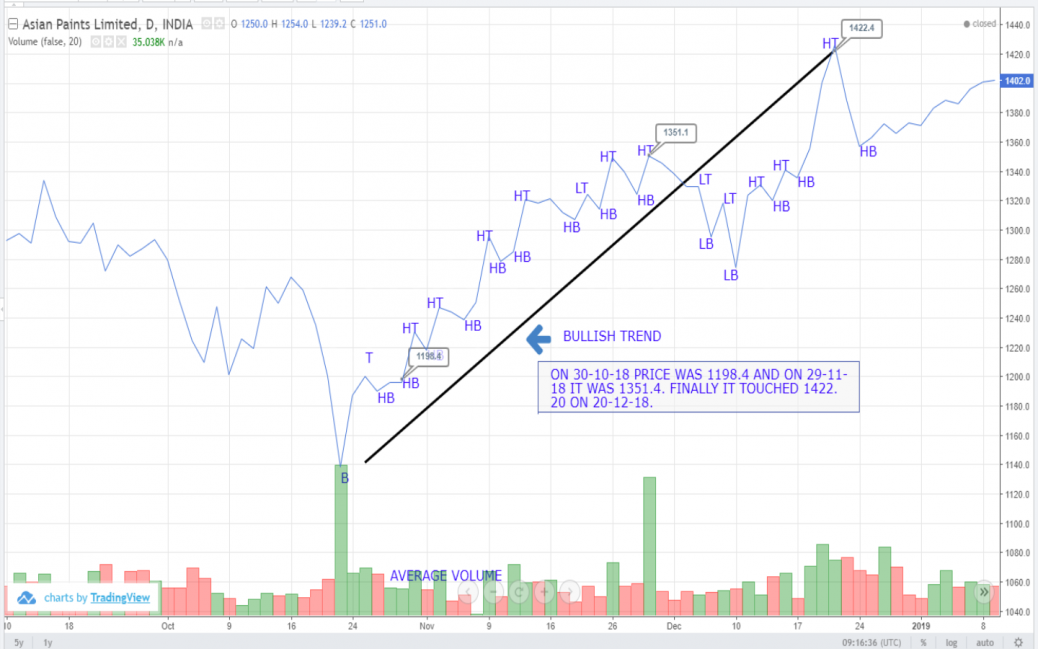
A five year line chart was selected. From 30-10-18 I noticed a bullish trend. The HB and HT are clearly showing a positive trend. The volume is average. Over a period of about two months the price increased from Rs 1198.40 to Rs 1422.40. As per Dow Theory if we connect the HB and HT and it forms a trend it is a clear indication of a bullish trend.


Hi,
Nice work!
Thank you.