
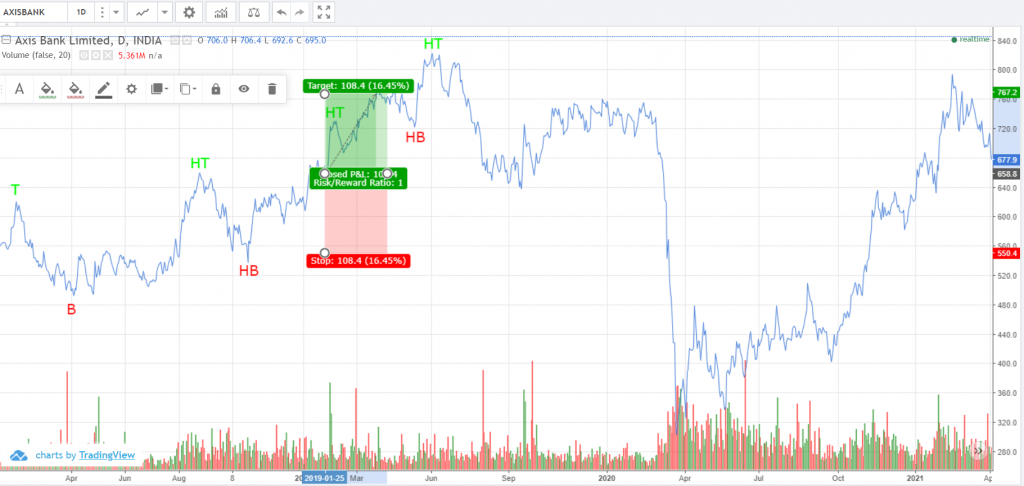
The 2 years data chart is taken the tops and bottoms are marked and concluded them as HIGHER TOP, HIGHER BOTTOM, LOWER TOP, LOWER BOTTOM.
For bullish the sequence of higher top higher bottom with considerable volume the long position is created.
The 2 years data chart is taken the tops and bottoms are marked and concluded them as HIGHER TOP, HIGHER BOTTOM, LOWER TOP, LOWER BOTTOM.
For bullish the sequence of higher top higher bottom with considerable volume the long position is created.