
1.To collect at least 3 years of data is the charting platform with line charts
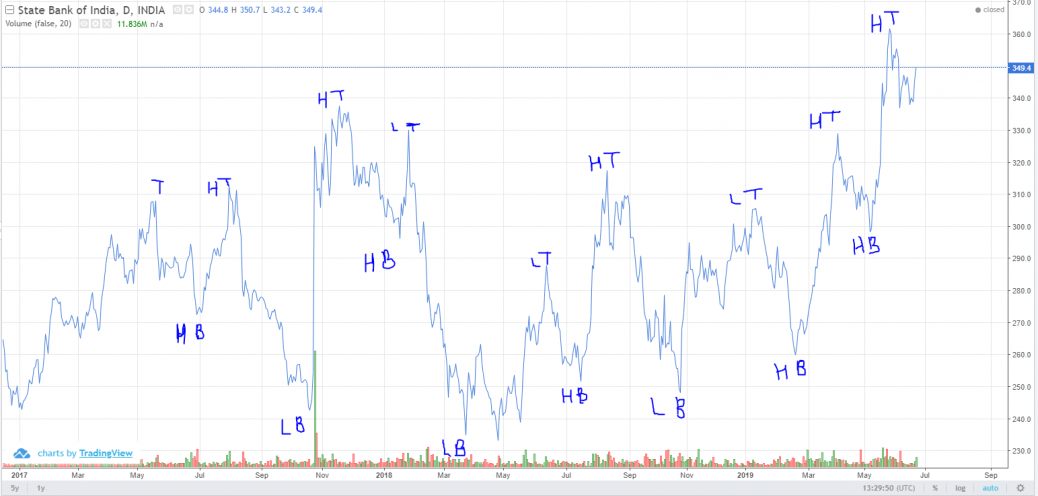
2. Find the tops and bottoms
3.To mark higher tops and lower bottom by comparing it with the previous one
4. To find the higher top and higher bottom
5. Calculate the profit and loss


Hi,
Request you to mark all the Top and Bottom in the chart (with 2 years data) and also mention the trade setup in the chart
Sir what is trade plan?
Trade plan is nothing but when to buy and sell the stock….. just mention a trade plan in the chart so that everyone can easily understand your analysis.