
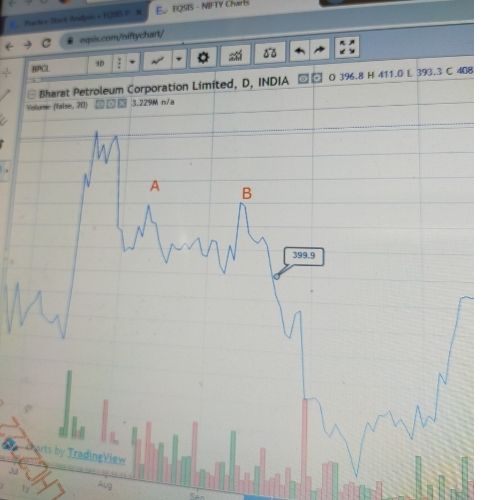
here we see at A and B a double top pattern and also we can see a volume increase at point B and we can also see this to tops are happening in a duration of 20 to 25 days horizon hence a short position can be considered as the stock reaches 399.9
sir kindly tell what should be the stop loss for it


Hi,
The Double top pattern is a reversal trading pattern that signals the end of a bullish trend and the start of a new bearish trend. Moreover, the double top appears at the end of an uptrend… In the above chart, the top A is not qualified because the prior trend seems like a downtrend… To qualify as a reversal pattern, there must be a prior trend to reverse.
Kindly post your analysis along with a screenshot.
To my understanding, previous top price shall be the stop loss.