
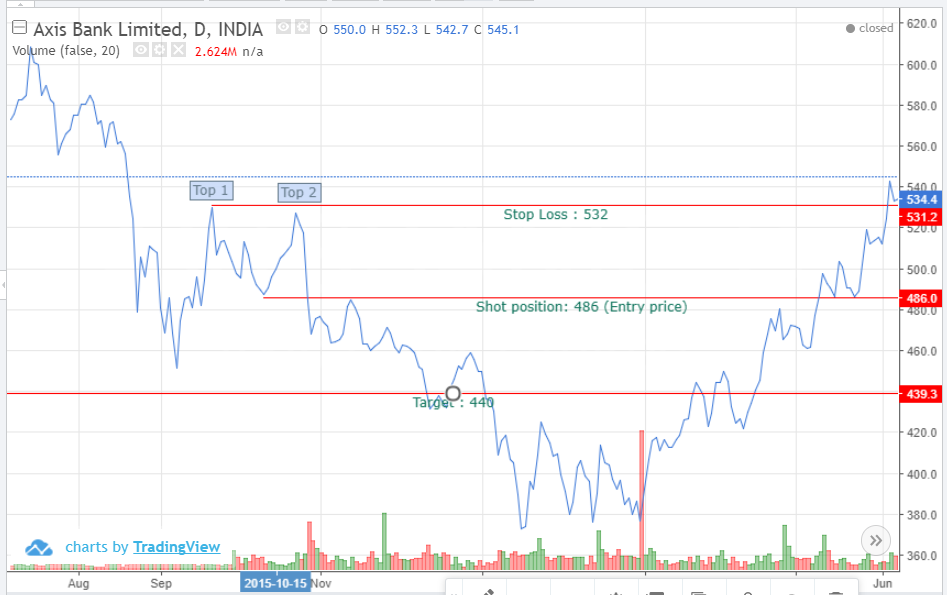
Today, I am identifying bearish trend using double top. I have taken the price chart of Axis Bank Ltd from 9th July 2015 to 30th June 2016.
In a double top, the duration between two tops should at least be one month and there should be a high volume at the second top. Both the tops should be at a similar price range. For Axus bank, I noticed two tops on 21st September and 23rd October around the price range of 532. These two tops indicate the resistance level where the sellers are strong. There is also a high volume around the second top.
Between these two tops, the bottom is formed at 487 indicating a support (buyers pressure) at that level. If the price falls below, breaking 487, that indicates the bearish trend. I can take a short position at 486.
Since the resistance was available (double tops) around 532, if the price rise above this level, it should trigger the stop loss. Hence, I marked the stop loss at 532.
My risk is Rs.46 (532 – 486). Hence I need a profit of at least 46. I have kept my target at 440 (486 – 46).
The price reached my entry price level (486) on 28-10-2015 and crossed my target price (440) on 12-12-2016, giving a return of around 10% in 2 months