
As the continuation of my practical analysis, today, I am identifying bullish trend using double bottom. I have taken the price chart of Asian Paints July 2015 to December 2016.
In a double bottom, the duration between two bottoms should at least be one month and there should be a high volume at the second bottom. Both the bottoms should be at a similar price range. For Asian paints, I noticed two bottoms on 19-Jan-2016 and 20-Feb-2016 around the price range of 832. These two bottoms indicate the support level where the buyers are available. There is also a high volume around the second bottom.
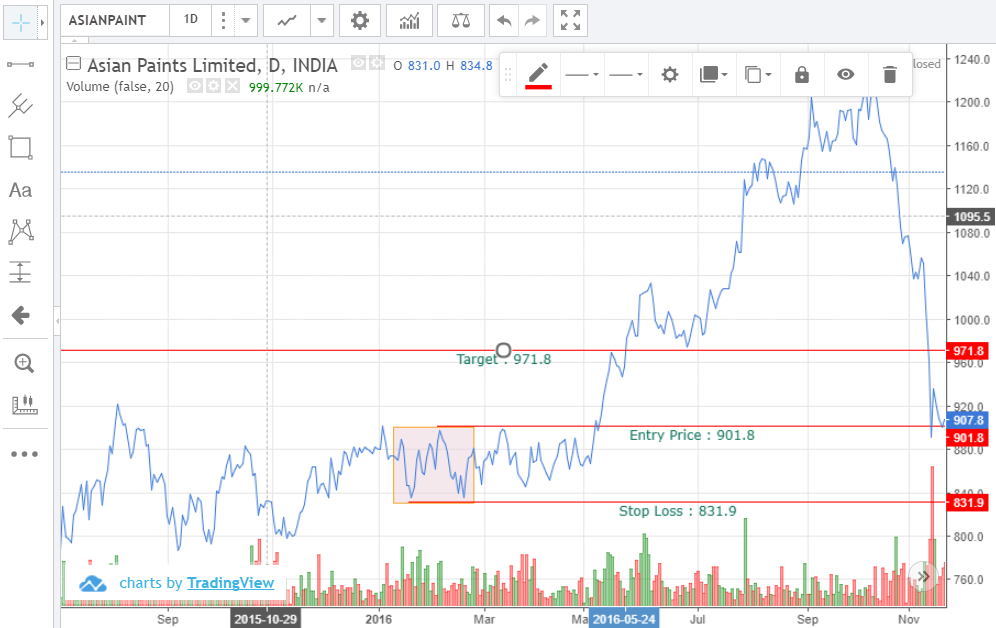
Between these two bottoms, the top is formed at 901.8 indicating a resistance (sellers presence) at that level. If the price rise above, breaking 901.8, that indicates the bearish trend. I can take a long position at 901.8.
Since the support was available (double bottoms) around 832, if the price falls below this level, it should trigger the stop loss. Hence, I marked the stop loss at 831.9.
My risk is Rs.69.9 (901.8 – 831.9). Hence I need a profit of at least 69.9. I have kept my target at 971.8 (901.8 + 70).
The price reached my entry price level (901.8) on 10-May-2016 and crossed my target price (971.8) on 24-May-2016, giving a return of around 7% in 14 days.