
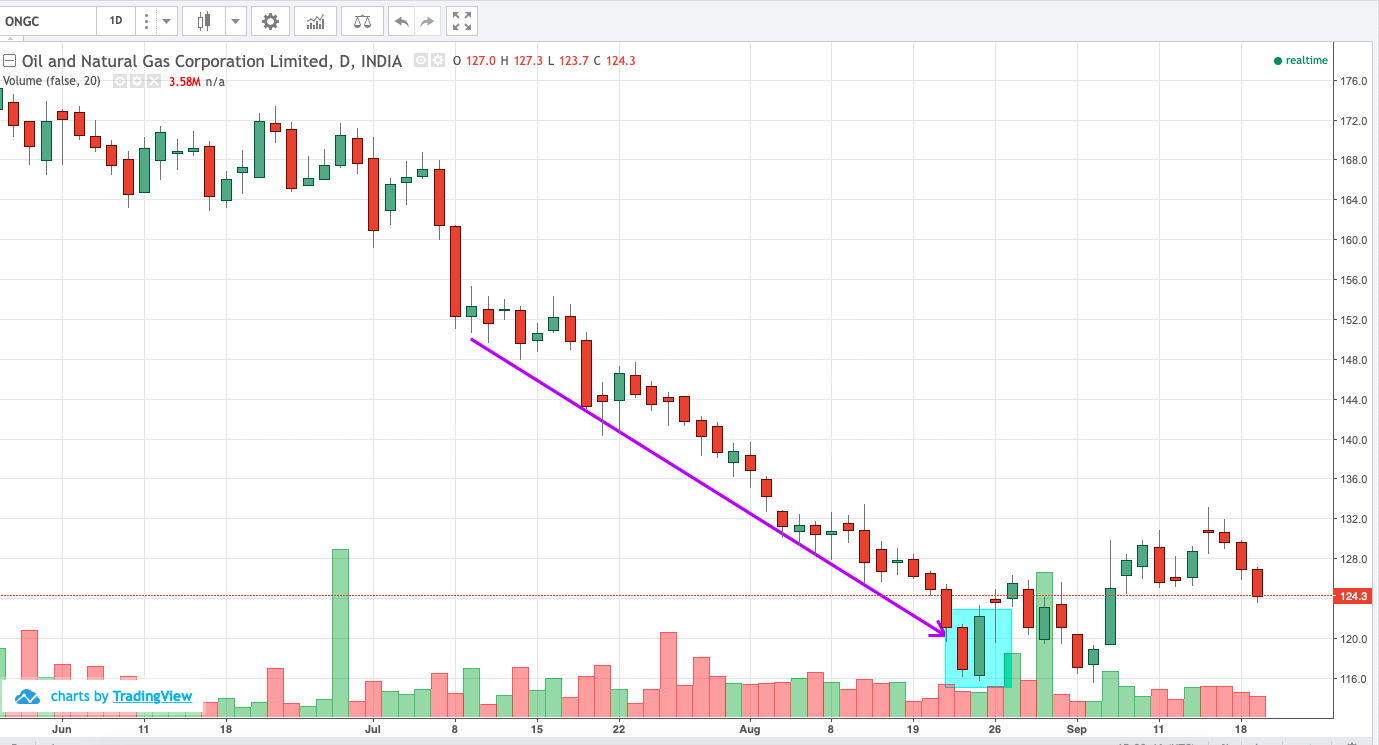
After significant down trend engulfing pattern is formed
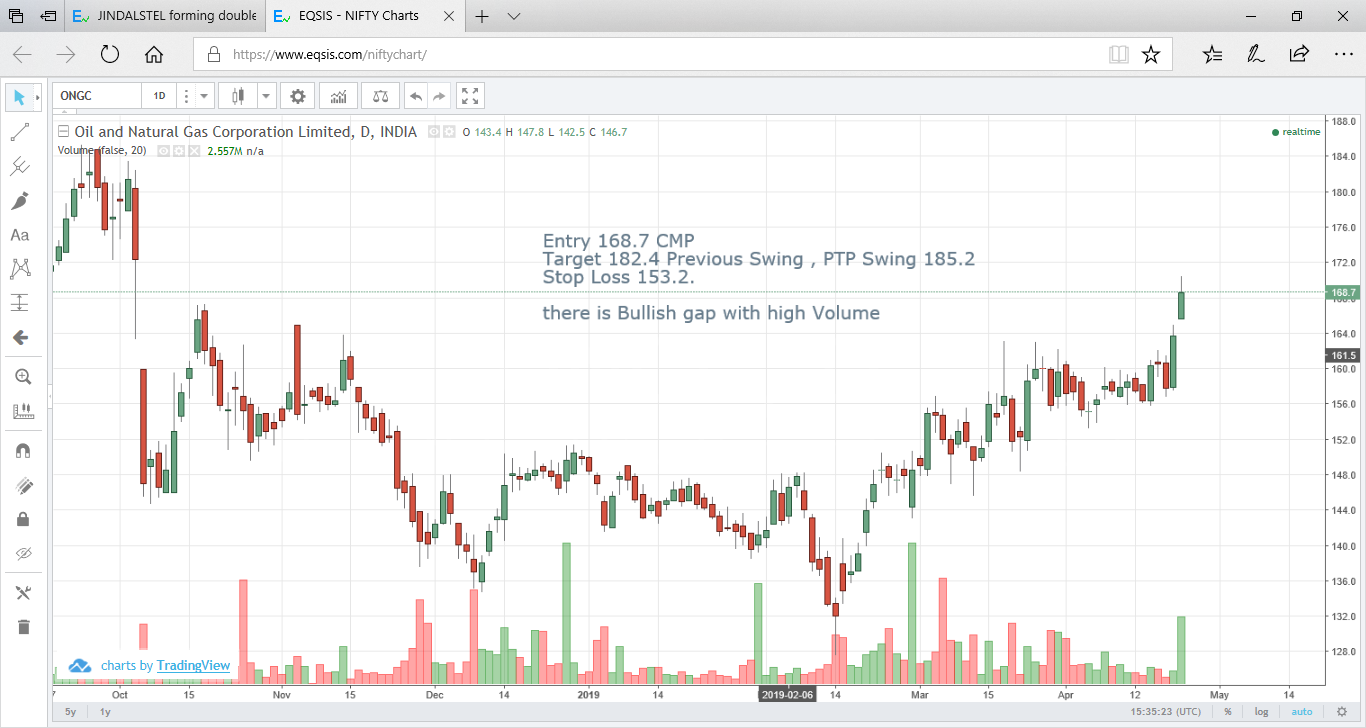
Area gap after sideways price movement with volume. Can be traded if price crosses previous day’s high with high...
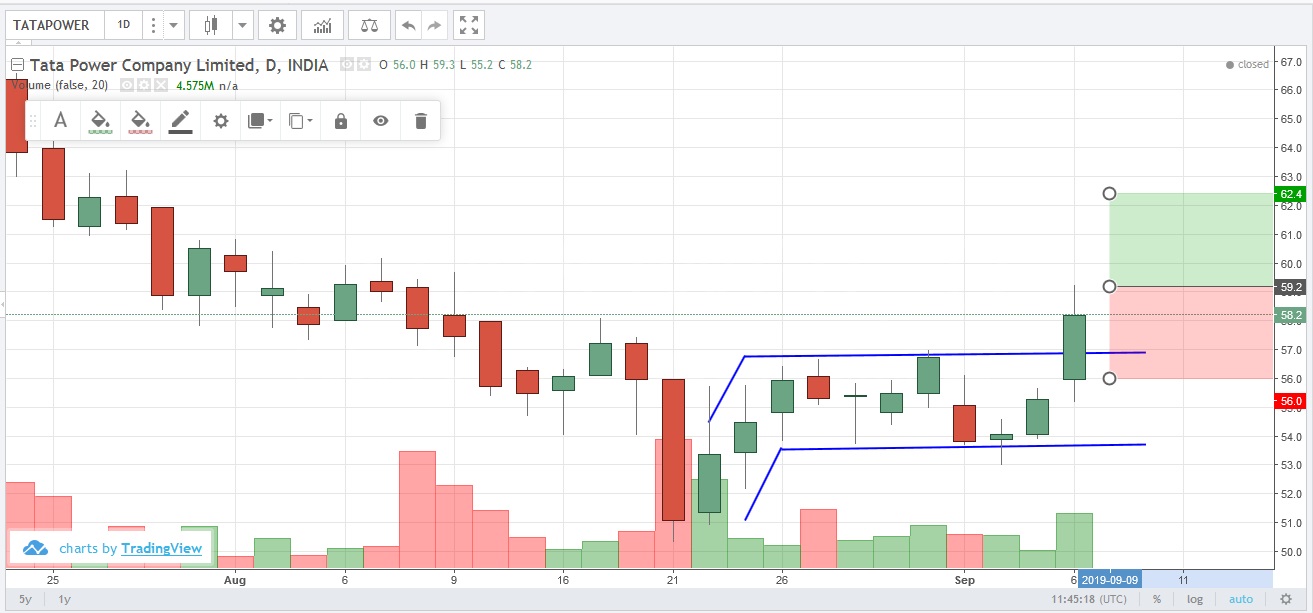
price pattern
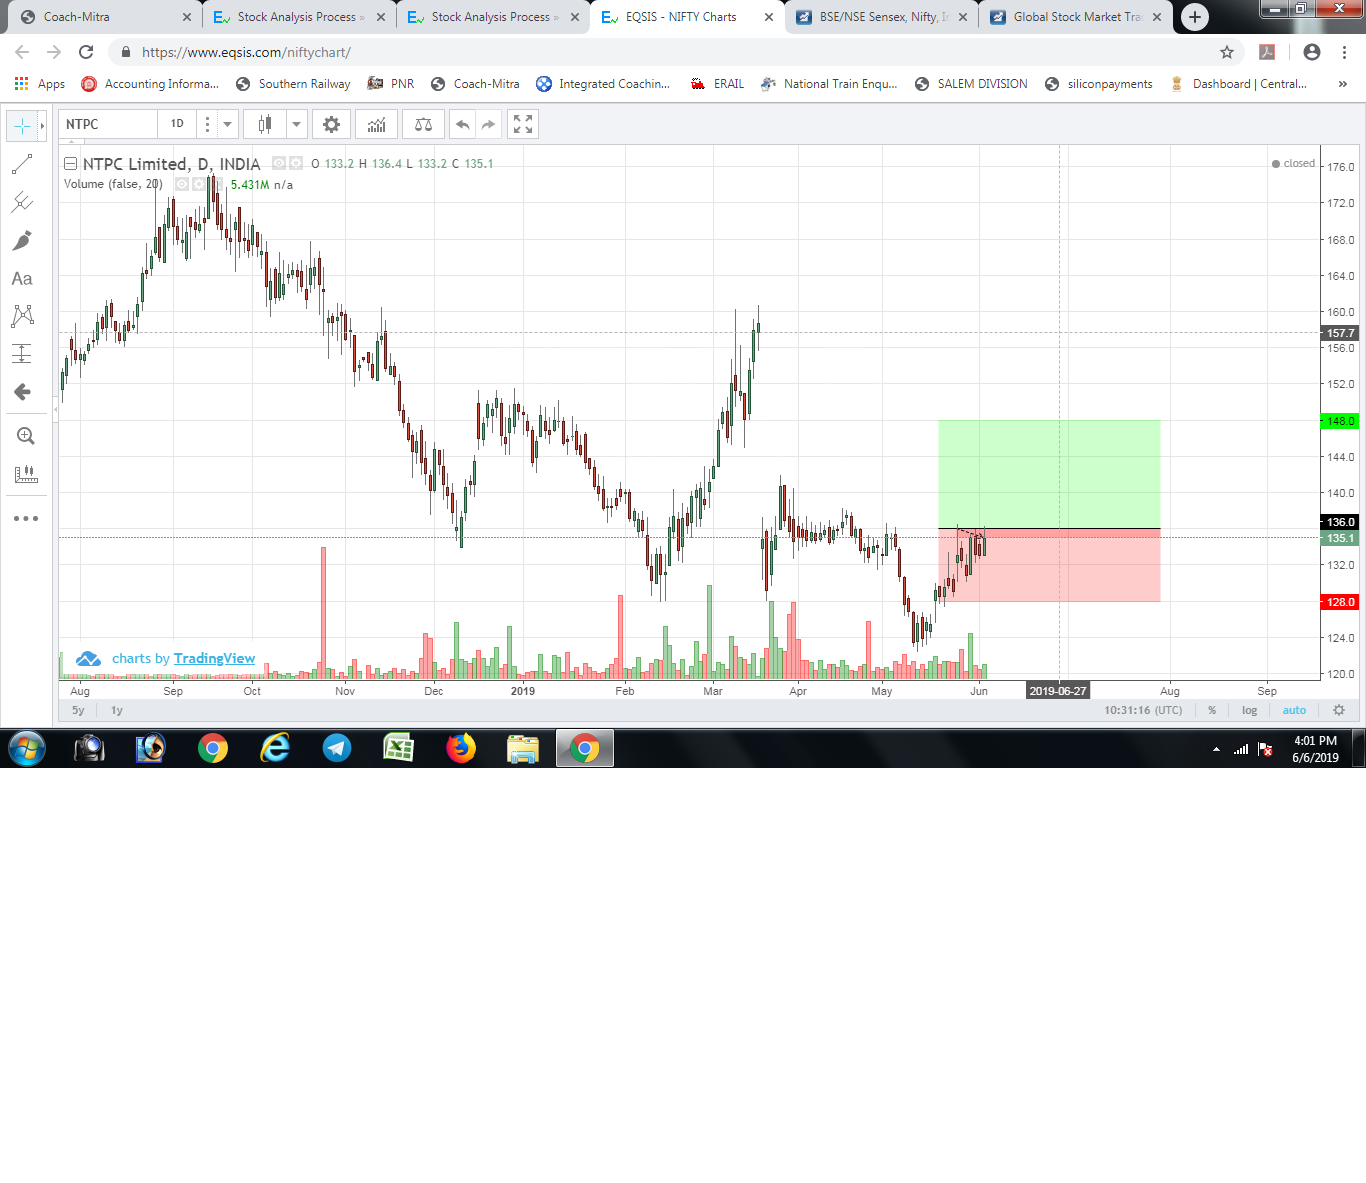
NTPC CURRENTLY CUP PATTERN . TWO DAYS BEFORE 130 TO 135 PRICE RANGE TRADING WITH HIGH VOLUME HENCE ABOVE ...
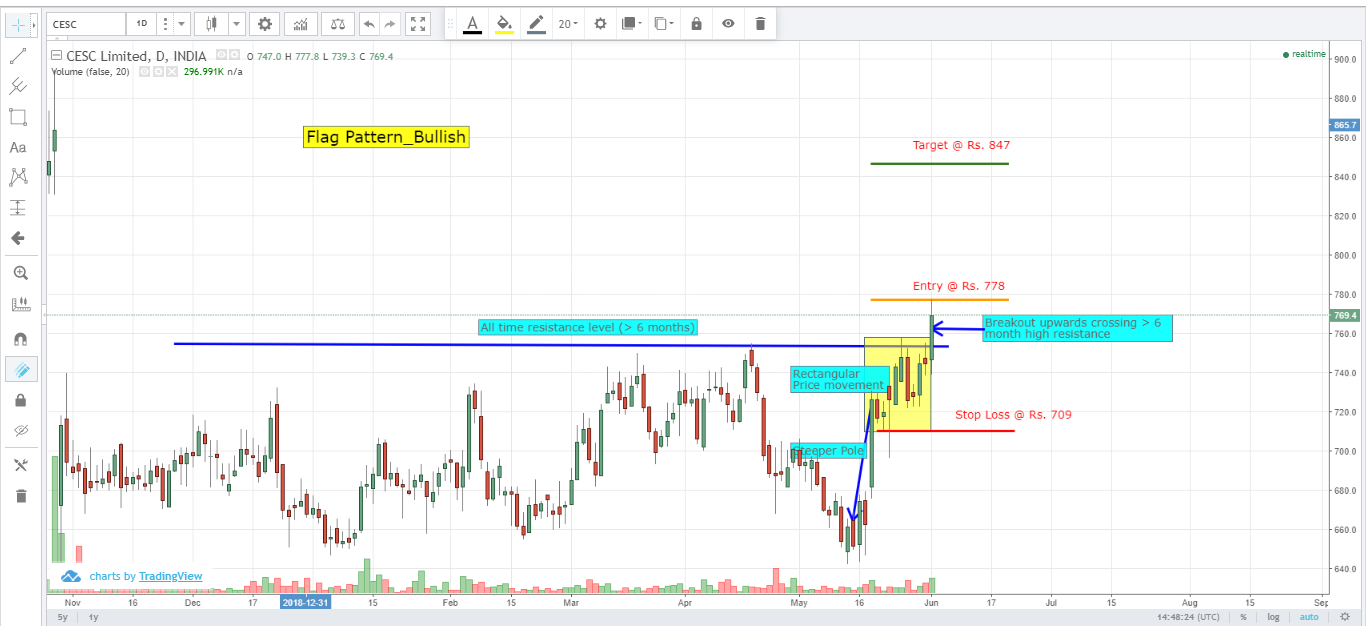
CESC Limited stock was chosen due to high volume on 03-Jun-19. Flag pattern noticed on 03-Jun-19 and breakout upwards...
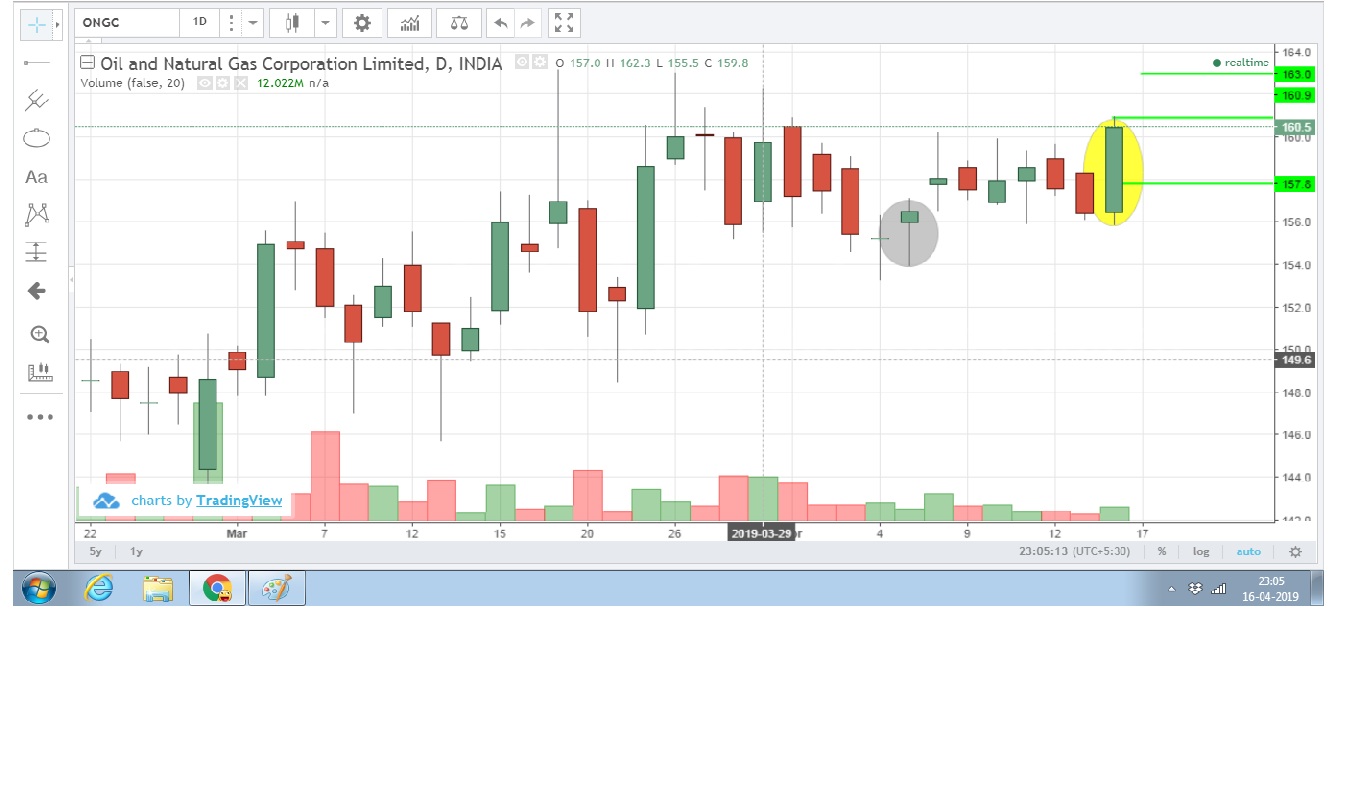
Bullish resistance breakout candle stick pattern formation can be seen with very high volume.
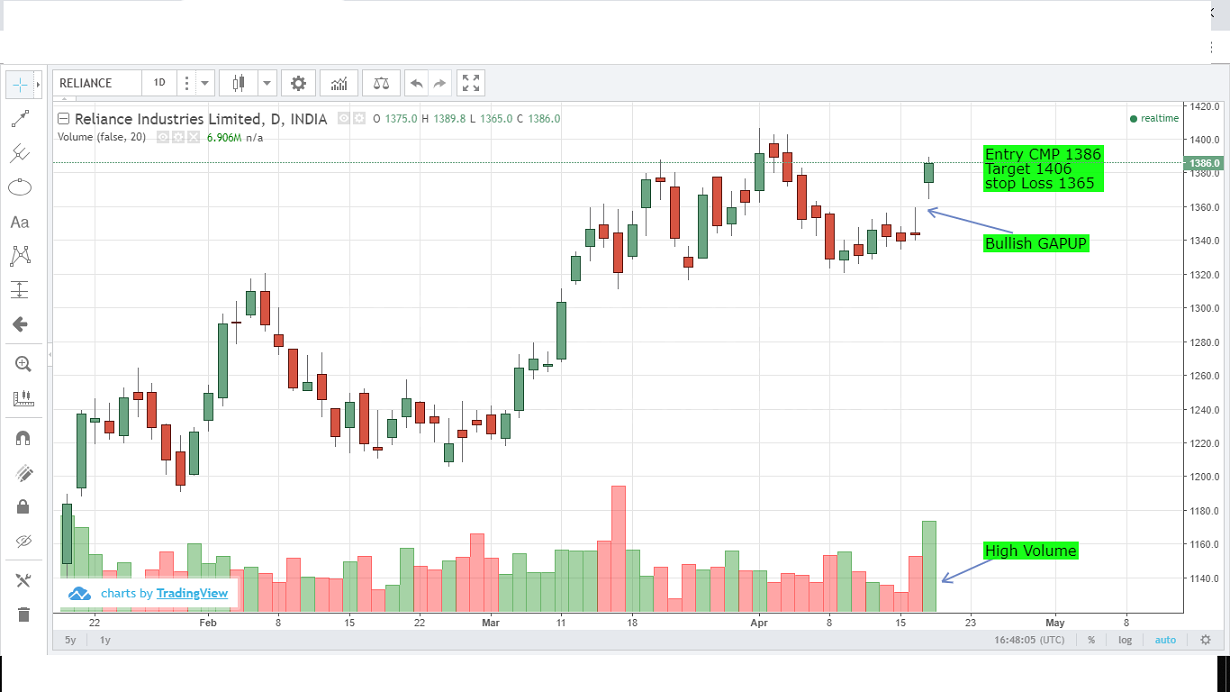
Bullish GAP UP Candle stick pattern formation is seen in reliance industries with high volume.
bull run latest
company formed few days before hammer and noe latest engulfing
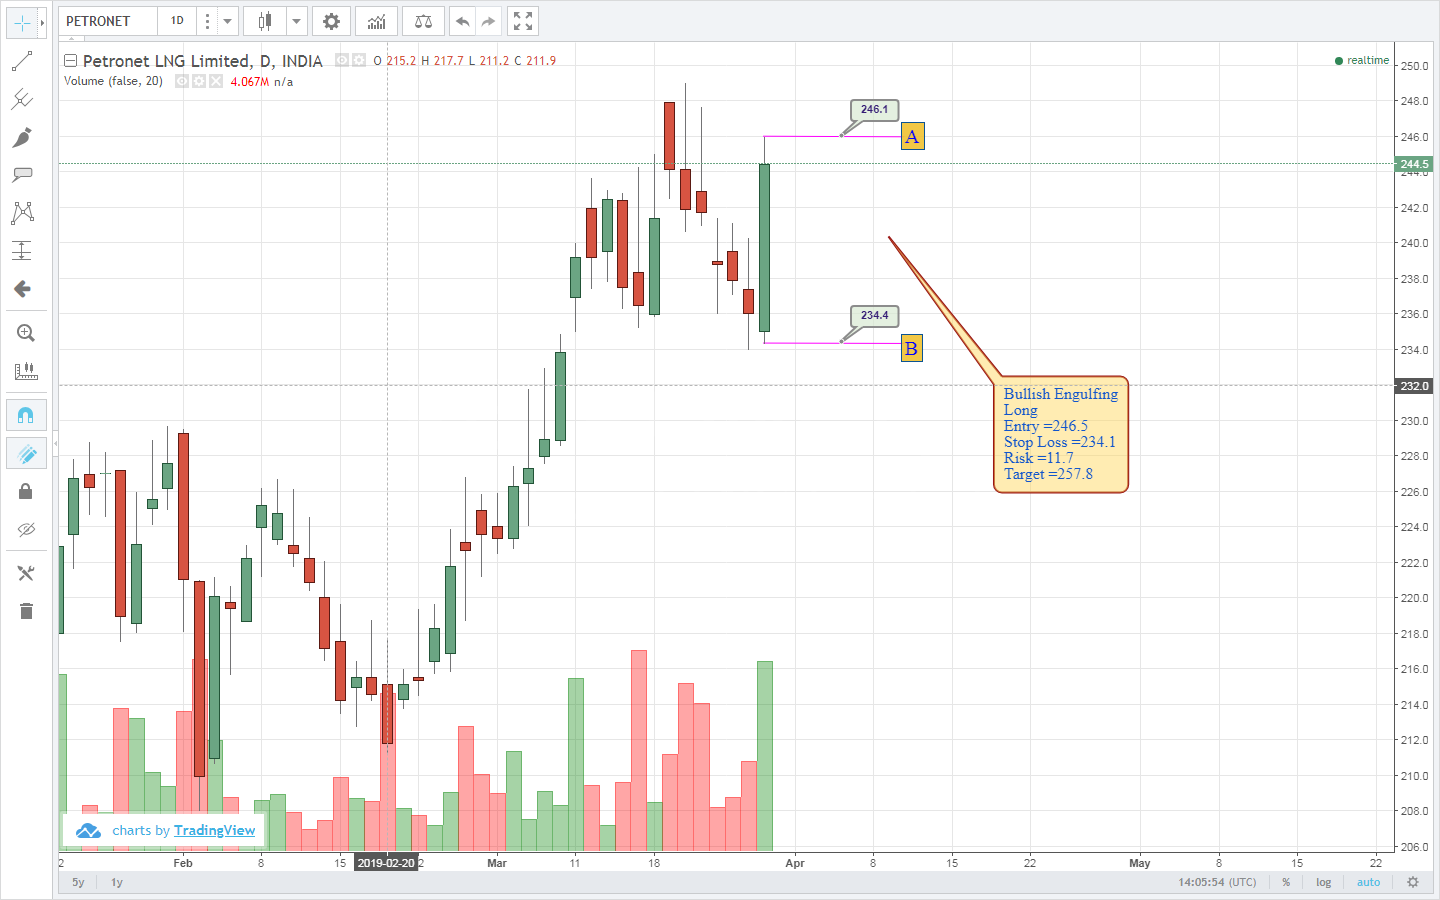
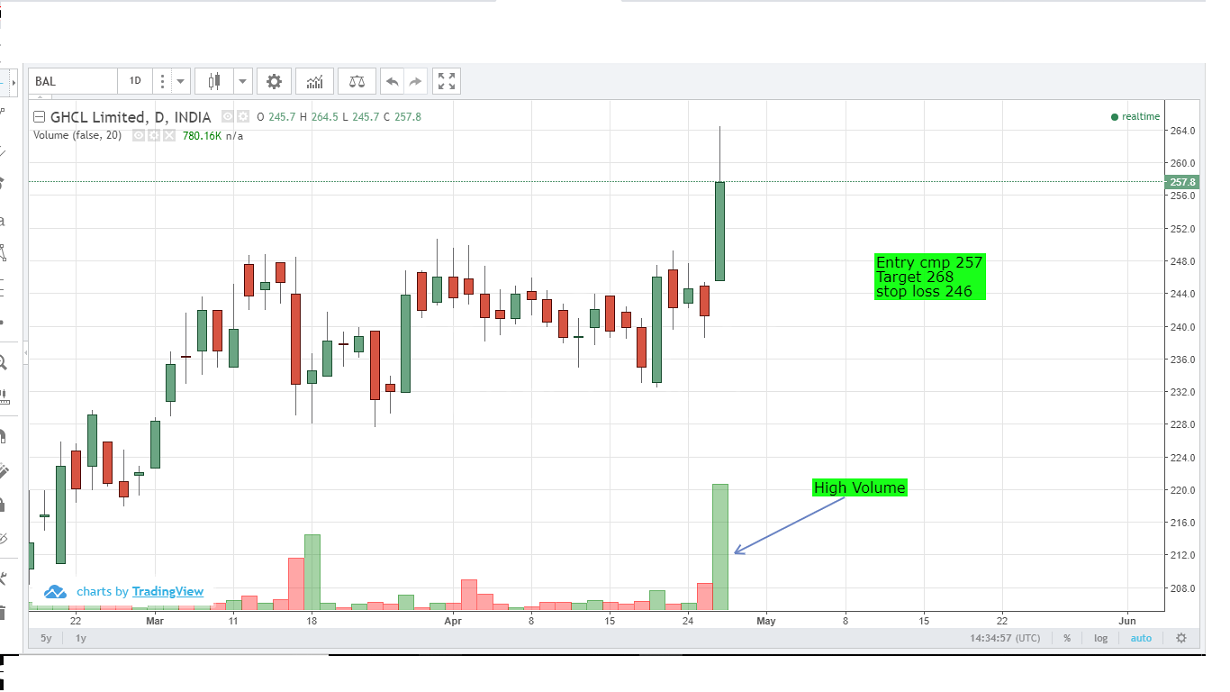
Bullish Engulfing Long Entry =246.5 Stop Loss =234.1 Risk =11.7 Target =257.8
Recently Active Members
Bullish View


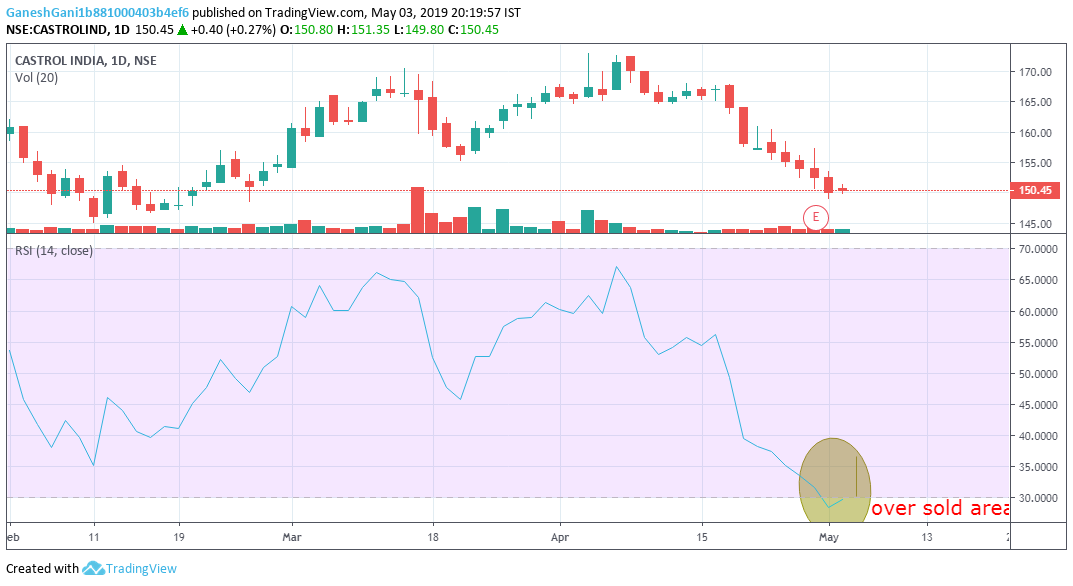
Bearish View
-
 Bearish-GAP-SHORT-BICON-25-10-2019 October 25, 2019
-
 FEDERAL BANK – BEARISH ENGULFING October 17, 2019
-
 Cummins India – Bearish Engulfing – 24Sep19 September 25, 2019
-
 Day29-Tata Motors DVR – Bearish Piercing – 12Sep19 September 12, 2019
-
 Day27-Bearish-Engulfing pattern-Tech Mahindtra-09Sep19 September 10, 2019