
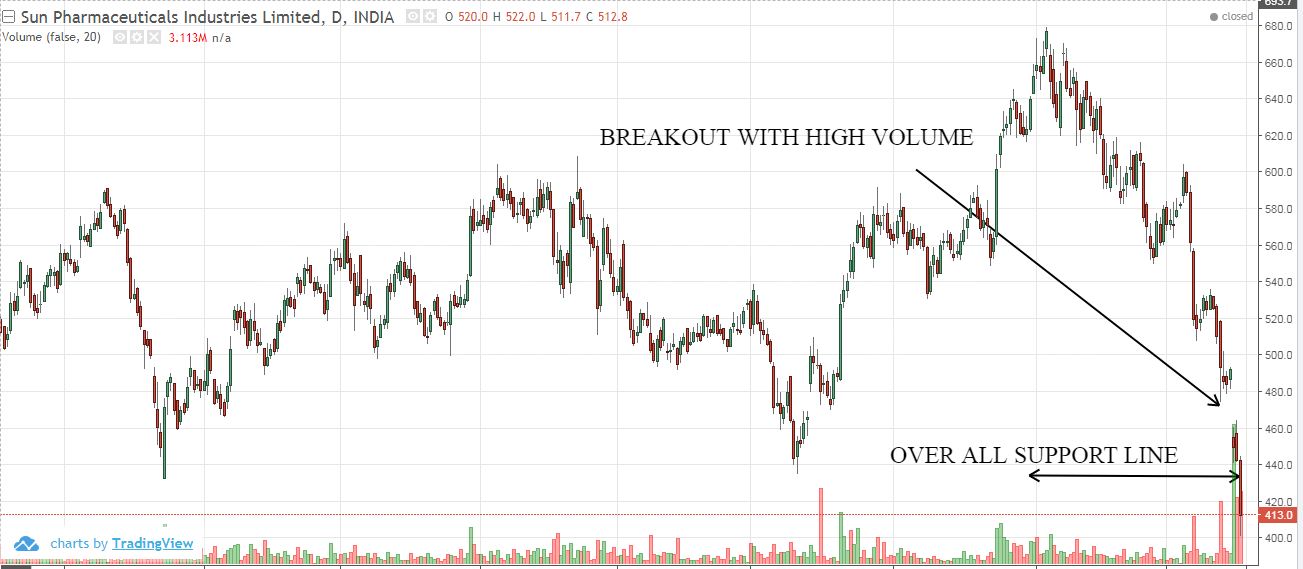
Sunpharma were trading at 52-week lower and appeared Breakout gap with high volume which indicates a bearish trend. For the...
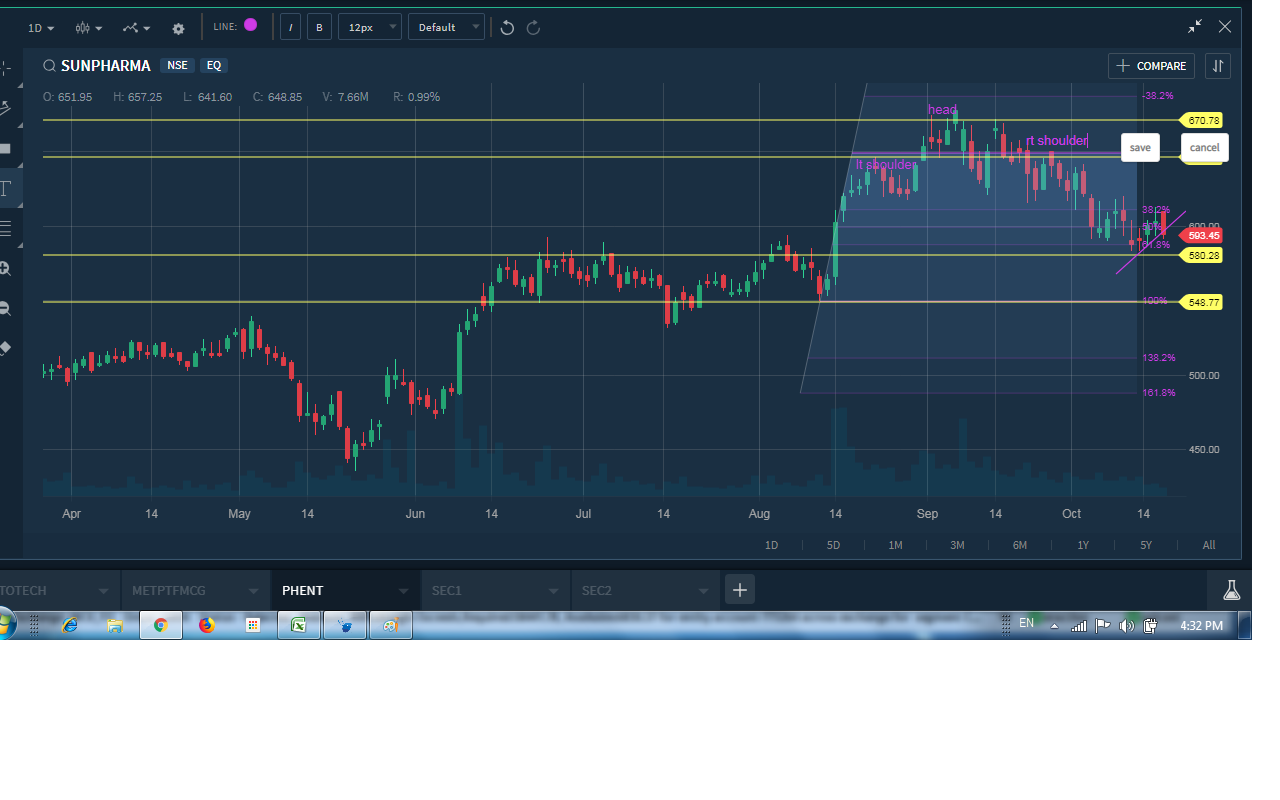
There is a head & shoulder formation high volume present in left shoulder and head formation. rt shoulder weak...
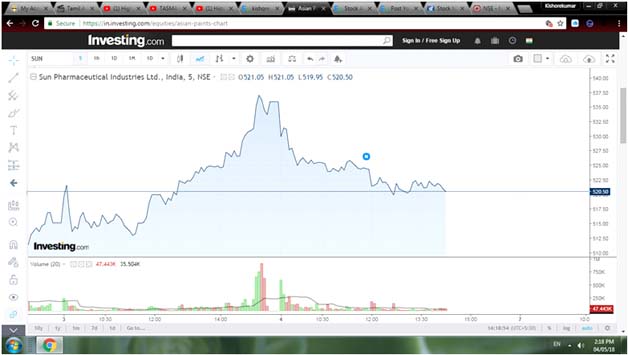
For Itraday itis sideways to bearish if broke 519.50 go for short sl 524.70 target 514.30
over all sector is negative . nifty also negative . intraday support seems at 519.50 in intraday chart
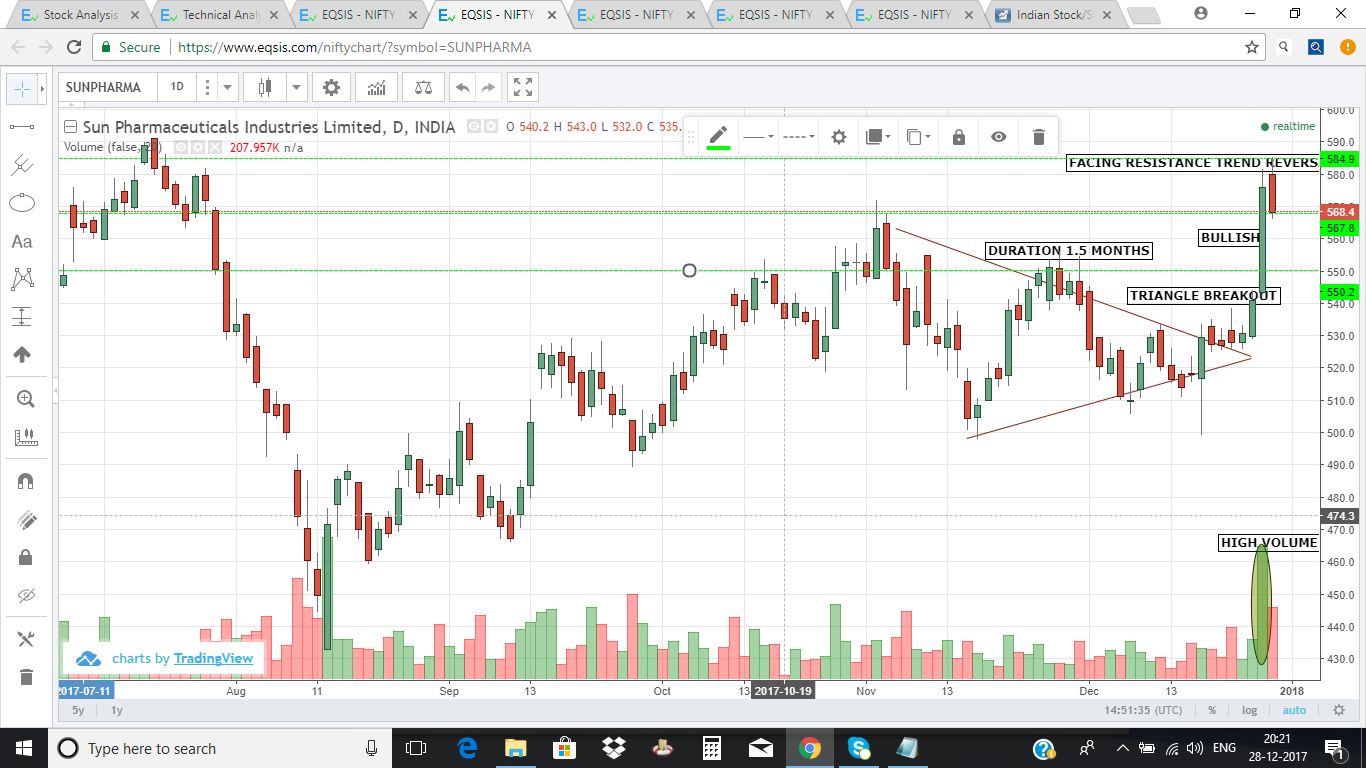
Triangle pattern noted for duration of more than 1.5 months in Sunpharma. Triangle brokeout to bullish with high volume...
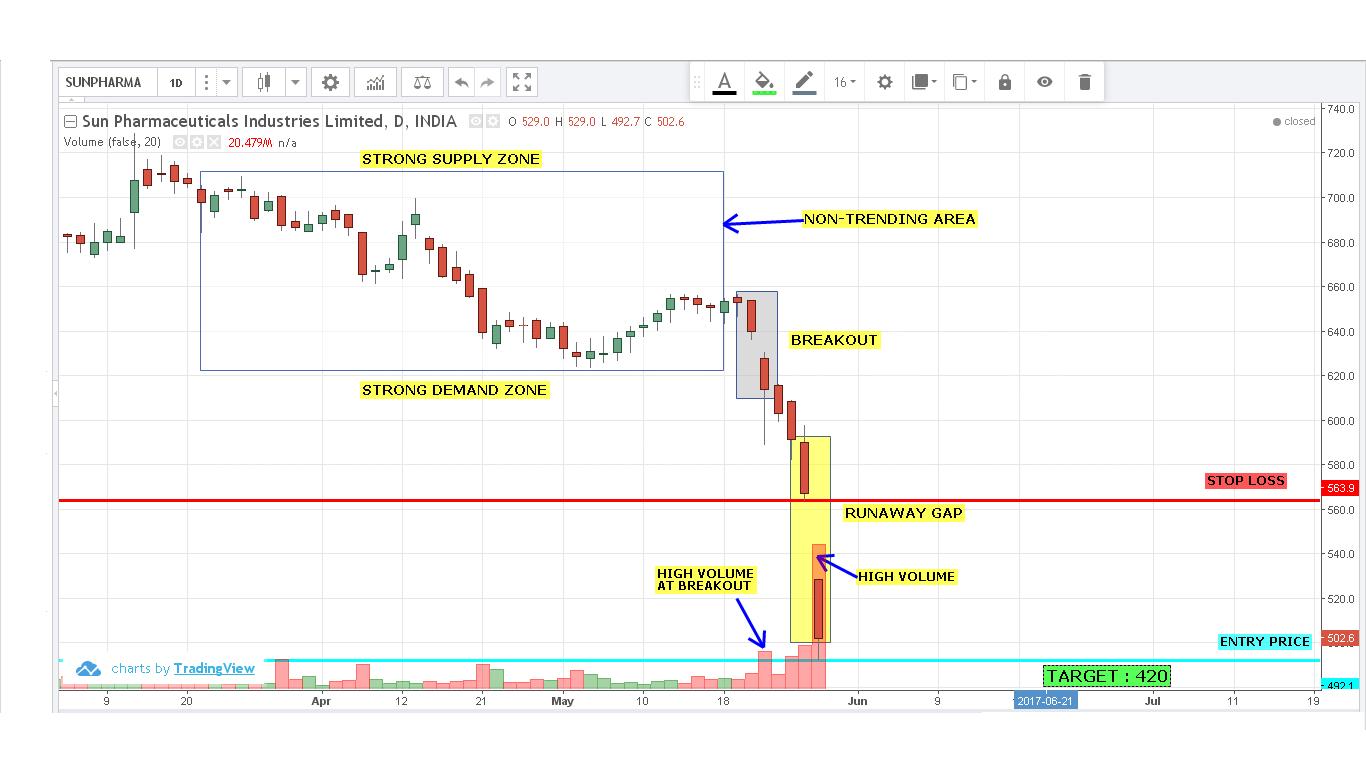
From the chart, it is seen that after a short non-trending area, a bearish breakout appears with high volume....
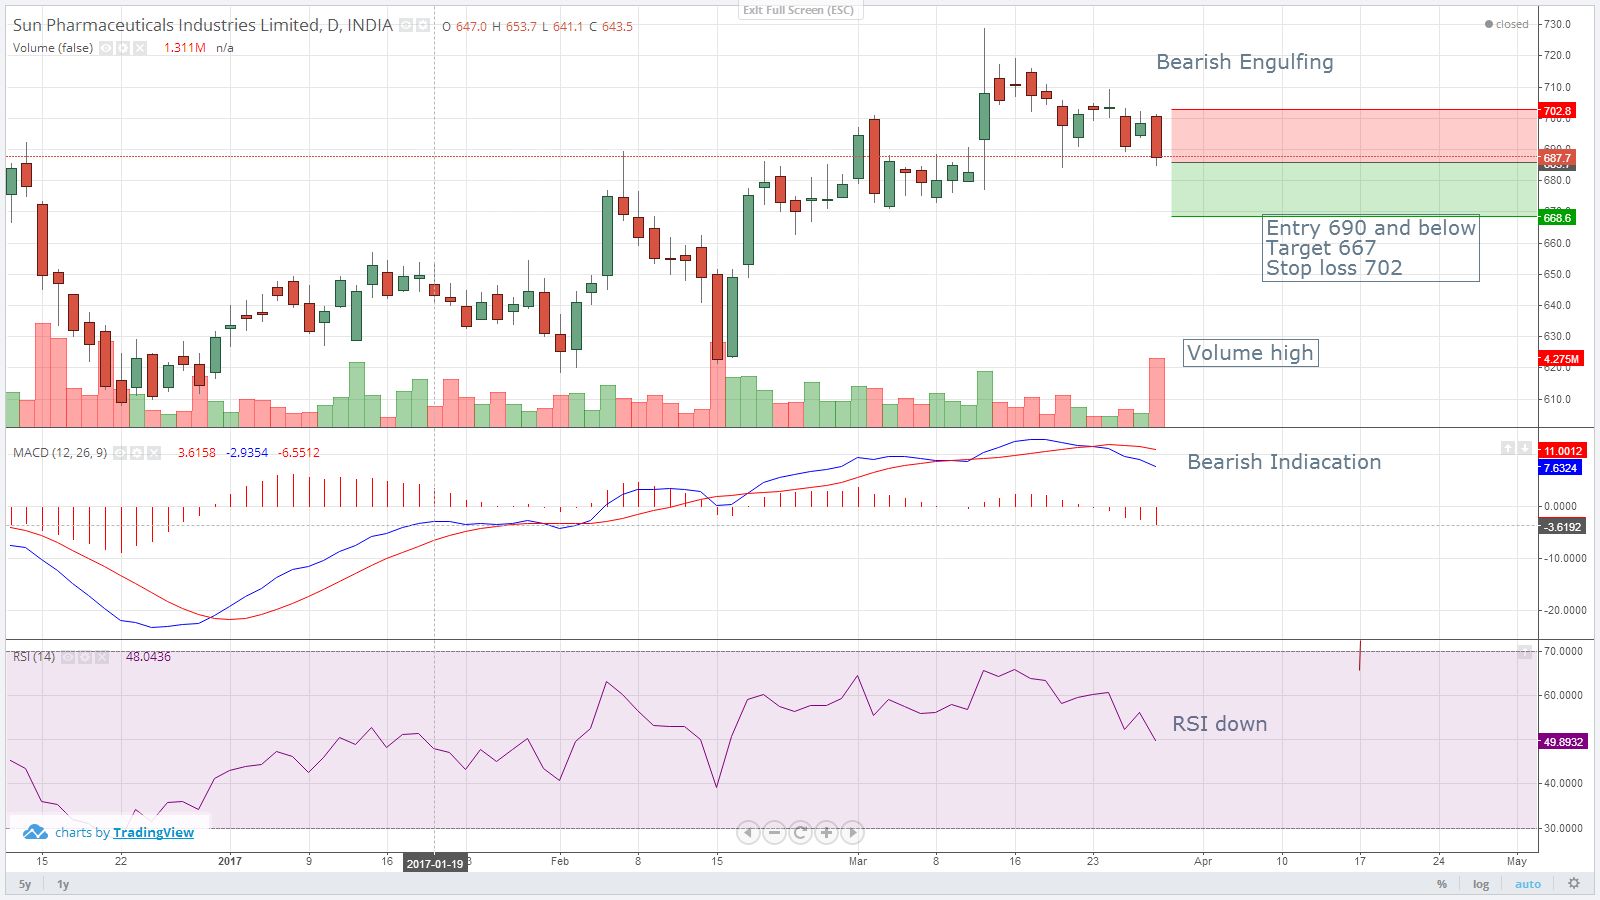
Today it formed bearish engulfing pattern . RSI and MACD sign also bearish . Voleme is higher than normal....
Recently Active Members
Bullish View


Bearish View
-
 Bearish-GAP-SHORT-BICON-25-10-2019 October 25, 2019
-
 FEDERAL BANK – BEARISH ENGULFING October 17, 2019
-
 Cummins India – Bearish Engulfing – 24Sep19 September 25, 2019
-
 Day29-Tata Motors DVR – Bearish Piercing – 12Sep19 September 12, 2019
-
 Day27-Bearish-Engulfing pattern-Tech Mahindtra-09Sep19 September 10, 2019