
Short position can be created. Bear in mind that there is a trendline support around rs 704 levels.
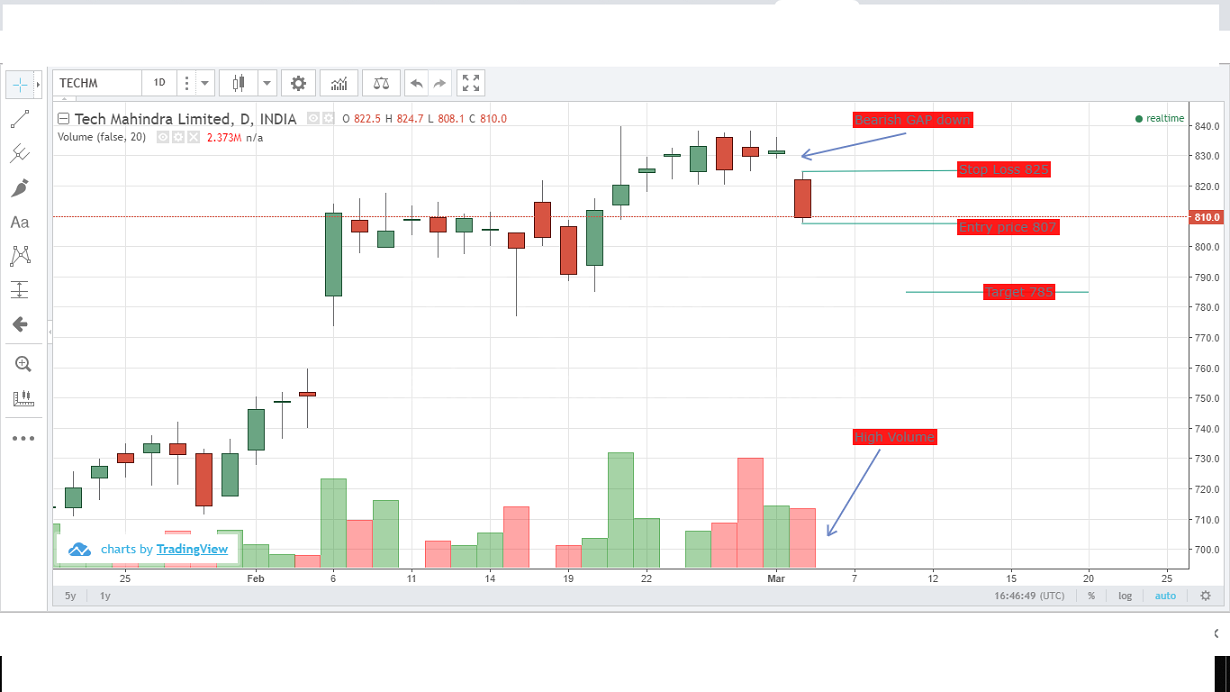
Bearish GAP down Candlestick pattern formation is seen in Tech Mahindra with good volume.
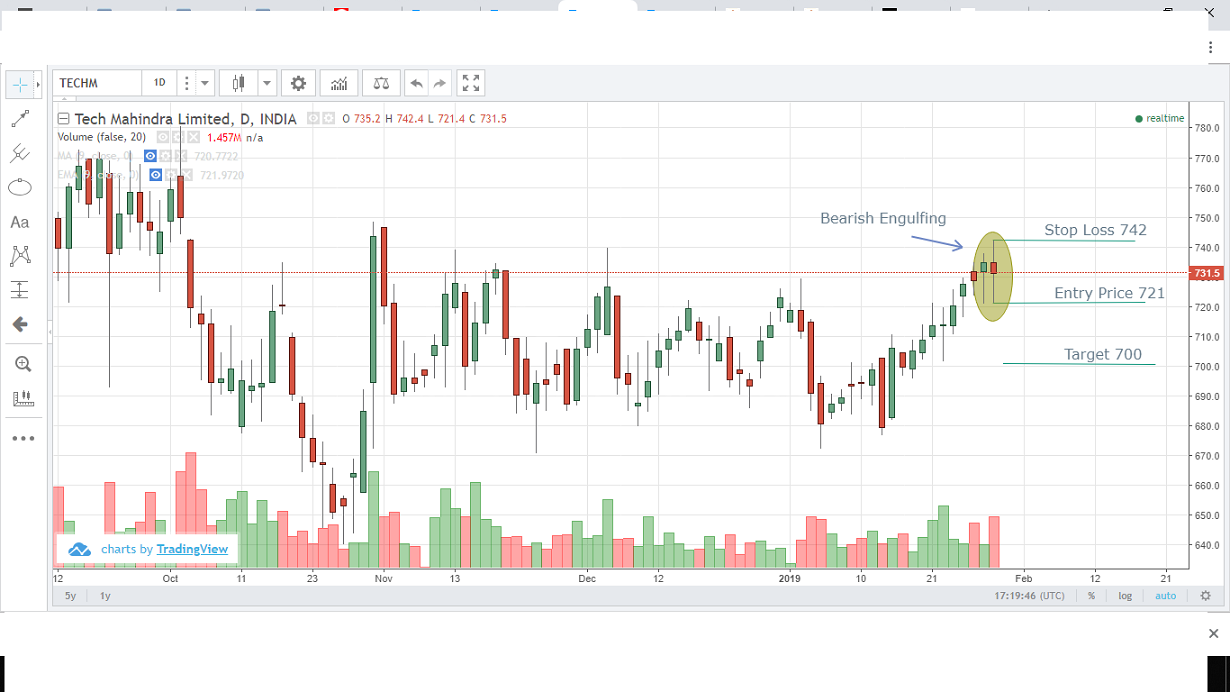
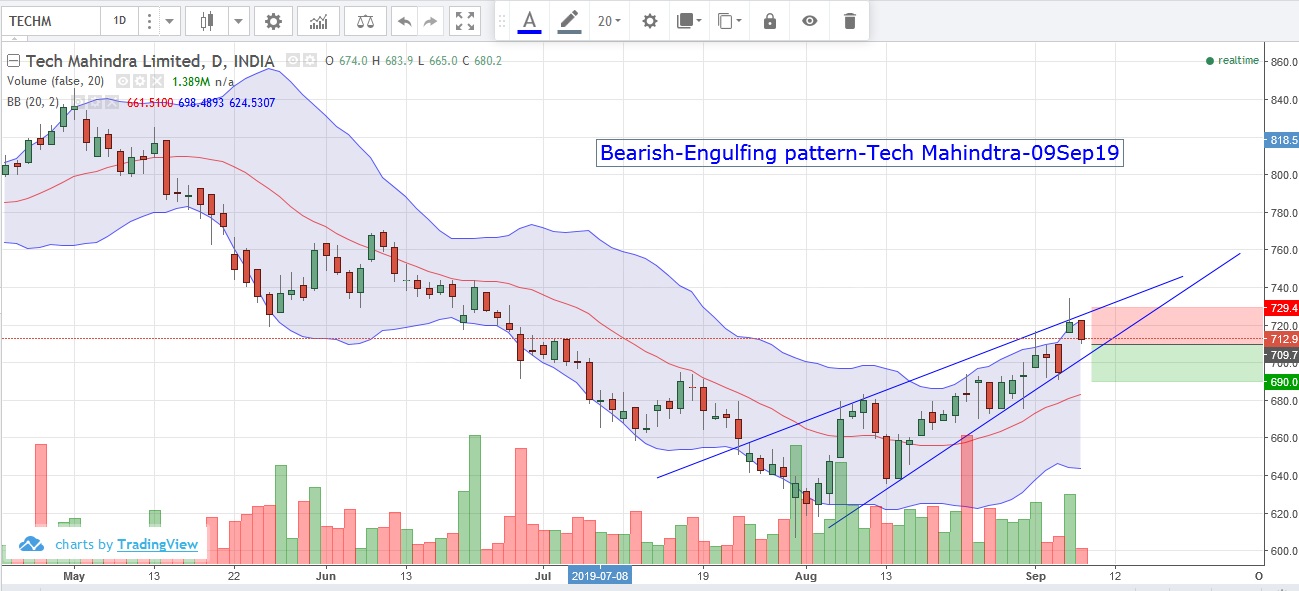
Bearish Engulfing Pattern formation can be seen in tech mahindra stock after prior bullish Rally with good volume
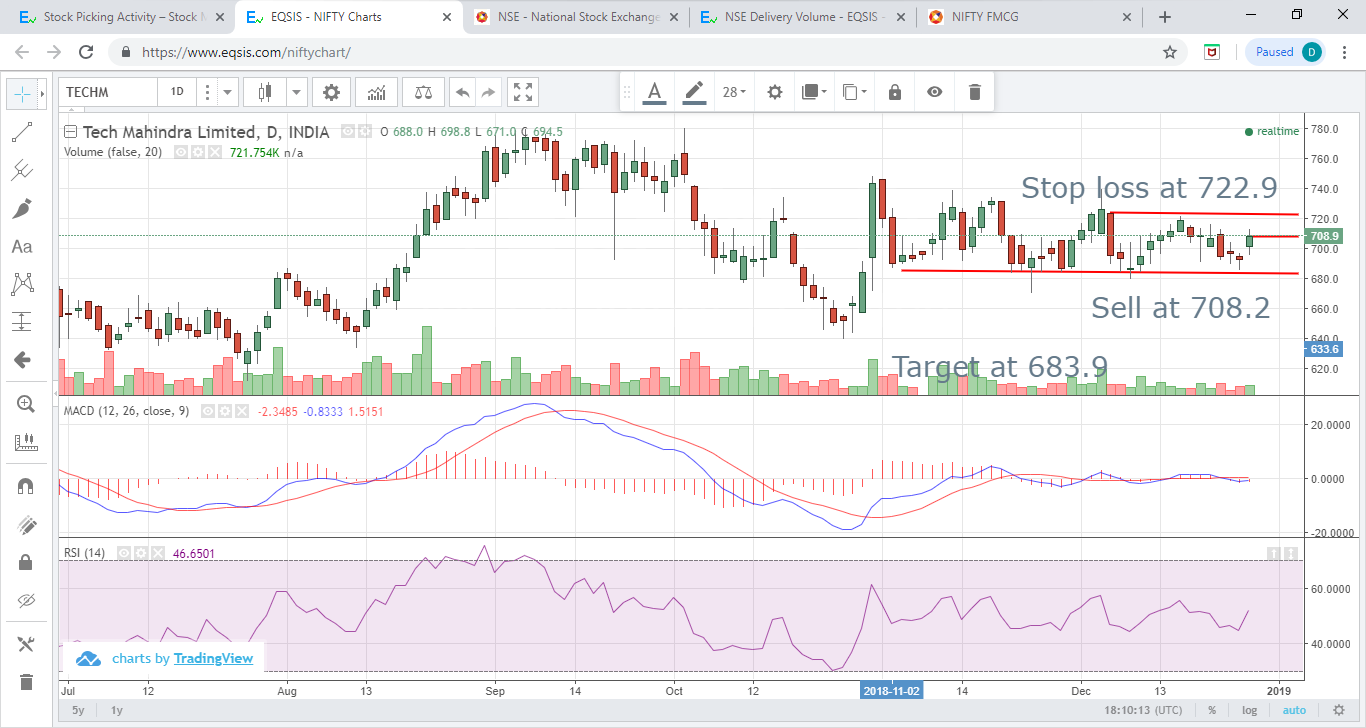
MACD pattern is showing to take a short position in Tech mahindra, the MACD line is below the signal...
Tech Mahindra is on consolidation; both bear and bull repeated in recent days; after a small uptrend TechMah is on facing...
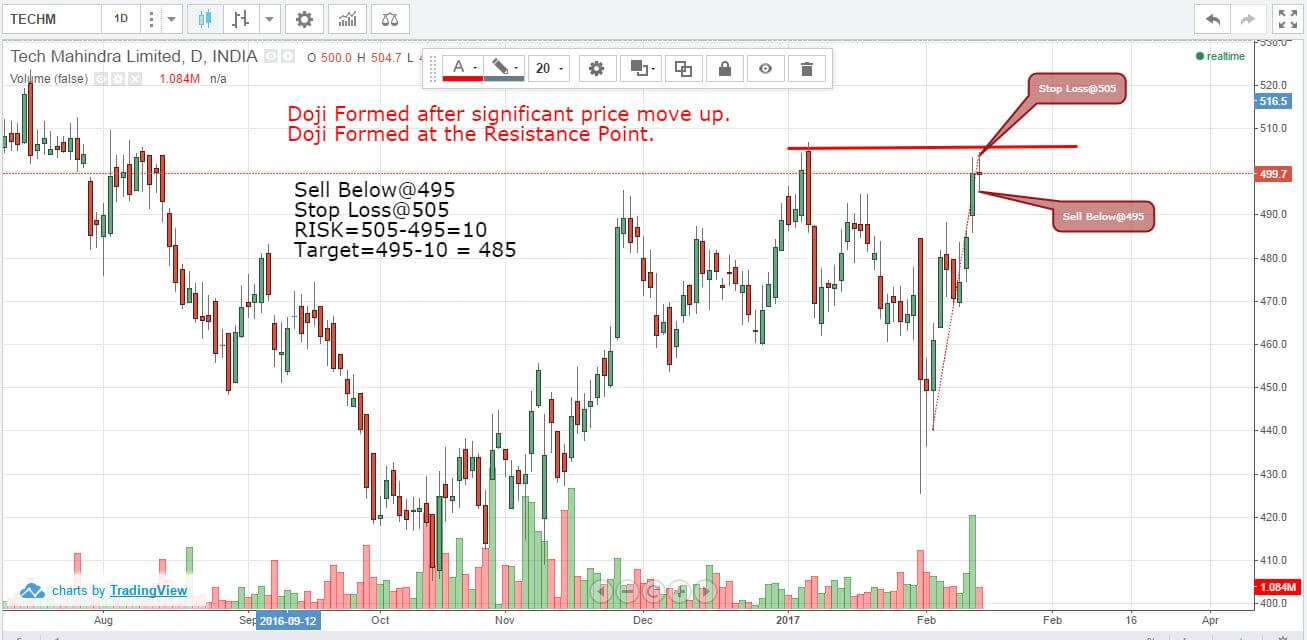
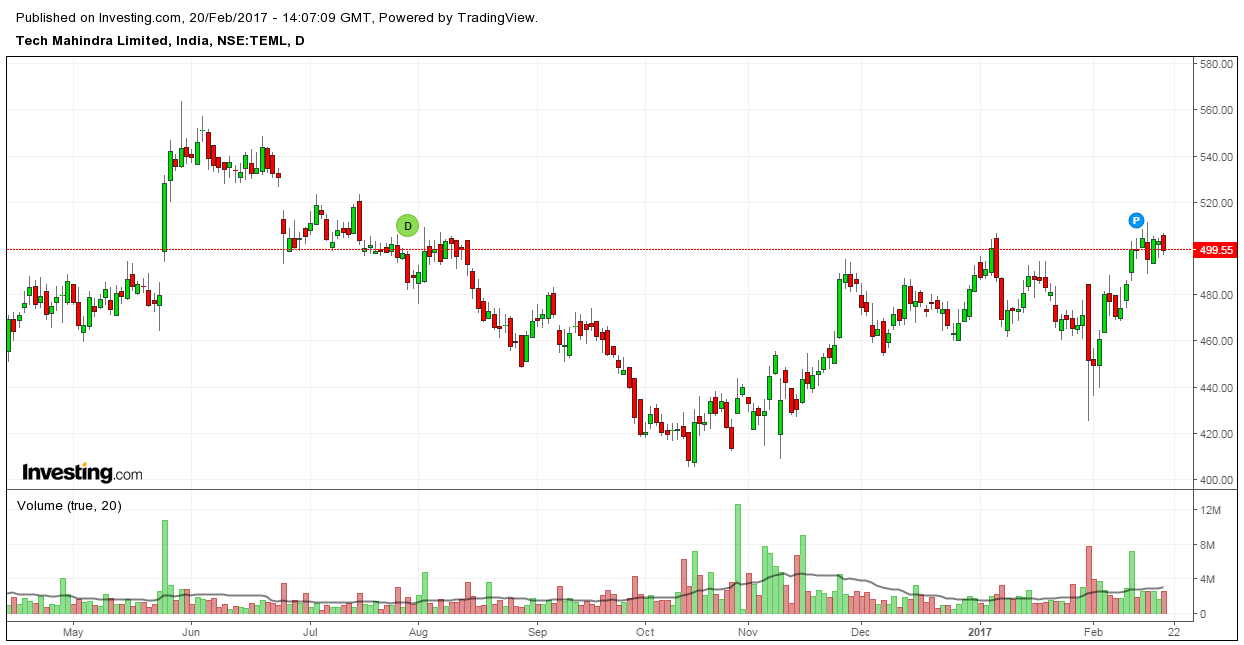
Doji Formed after significant price move up. Doji Formed at the Resistance Point.
Recently Active Members
Bullish View


Bearish View
-
 Bearish-GAP-SHORT-BICON-25-10-2019 October 25, 2019
-
 FEDERAL BANK – BEARISH ENGULFING October 17, 2019
-
 Cummins India – Bearish Engulfing – 24Sep19 September 25, 2019
-
 Day29-Tata Motors DVR – Bearish Piercing – 12Sep19 September 12, 2019
-
 Day27-Bearish-Engulfing pattern-Tech Mahindtra-09Sep19 September 10, 2019