
Relative Strength Index is a Technical Indicator.
It works in the Non Trending Zone. The Index is marked at 30 and 70.
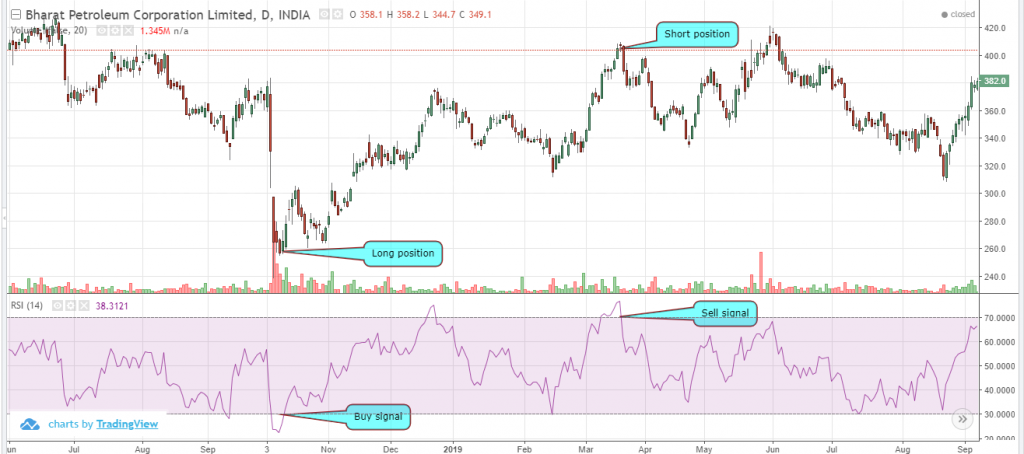
When the graph cut the 70 line from top to it indicates a over bought signal and one can go short.
Similarly when the 30 line in cut from bottom to top it indicates an over sold signal and one can go long.